Hi,
sorry, I'm new in Node-Red and to be honest I'm also new in Javascript but ....
... I want to learn.
I would like to display in a dashboard some power values vs time.
I have cretare a MariaDB table like the one below:
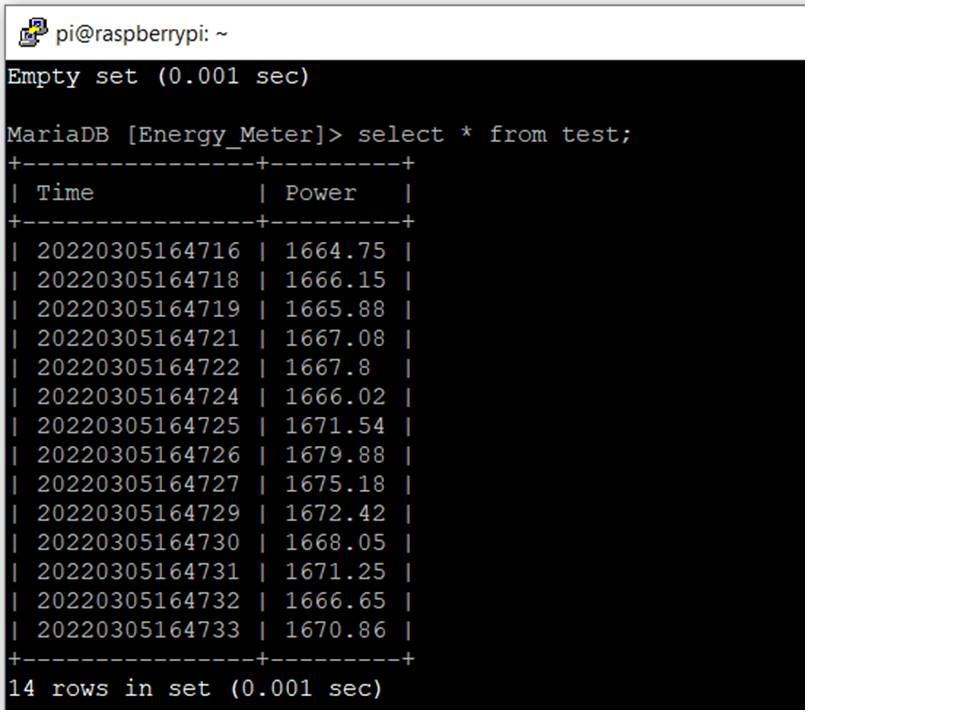
I'm able to see the Y values but not the X (date) ones.
It seems I cannot upload the flow but below the function I create to do that:
var data = [];
var label = [];
msg.payload.forEach(function(value) {
    data.push(value['Power']);
    label.push(value['Time']);
});
msg.payload = [{
    series: "",
    data: [data],
    labels: [label]
}];
return msg;
but the result is very disappointing.

If I replace labels with
labels: [1,2,3,4,5,6,7,8,9,10,11,12,13,14]
the results is much e better but I would like to see the time in X and not some fixed values
Any support is welcome.
Grazie