Hi,
could I get some help with InfluxDB Queries for V2?
I used to use Influx v1.8 and am now trying to migrate to v2, but retrieving multiple time series in one go, like I did before, does not work right now.
Retrieving for example average temperatures of the last 30hours works for me like this:
[{"id":"83c863c322ea5dda","type":"inject","z":"da97d878.d3d728","name":"5m","props":[{"p":"payload"},{"p":"topic","vt":"str"}],"repeat":"300","crontab":"","once":true,"onceDelay":"3","topic":"","payload":"","payloadType":"date","x":450,"y":2580,"wires":[["b49dbc4c32f0921c"]]},{"id":"8fe384390823b16b","type":"ui_chart","z":"da97d878.d3d728","name":"","group":"f72a94e6.10d108","order":2,"width":0,"height":0,"label":"Temperatur (30h glatt 5m)","chartType":"line","legend":"false","xformat":"HH:mm:ss","interpolate":"linear","nodata":"No data","dot":false,"ymin":"","ymax":"","removeOlder":"30","removeOlderPoints":"","removeOlderUnit":"3600","cutout":0,"useOneColor":false,"useUTC":false,"colors":["#1f77b4","#aec7e8","#ff7f0e","#2ca02c","#98df8a","#d62728","#ff9896","#9467bd","#c5b0d5"],"outputs":1,"useDifferentColor":false,"className":"","x":1050,"y":2580,"wires":[[]]},{"id":"b49dbc4c32f0921c","type":"influxdb in","z":"da97d878.d3d728","influxdb":"1f7575cc.59429a","name":"Temp","query":"import \"math\"\n\nfrom(bucket:\"sensordb\")\n |> range(start: -30h)\n |> filter(fn: (r) => \n r._measurement == \"BME280\" and \n r._field == \"temp\")\n |> aggregateWindow(every: 5m, fn: mean, createEmpty: false)\n |> map(fn: (r) => ({ r with _value: math.round(x: r._value) }))\n\n","rawOutput":true,"precision":"","retentionPolicy":"","org":"dibu","x":610,"y":2580,"wires":[["41b4cbe9e4c8727d","289b45c59df30246"]]},{"id":"41b4cbe9e4c8727d","type":"change","z":"da97d878.d3d728","name":"prep chart v05","rules":[{"t":"set","p":"payload","pt":"msg","to":"[\t {\t \"series\": [$.payload[0]._field],\t \"labels\": [\"\"],\t \"data\": [\t $[].[\t $.payload.(\t $._value != null ? {\"x\": $toMillis(_time),\"y\": _value}\t )\t ]\t ]\t}\t]\t","tot":"jsonata"}],"action":"","property":"","from":"","to":"","reg":false,"x":800,"y":2580,"wires":[["8fe384390823b16b","17378eab49b3eb17"]]},{"id":"289b45c59df30246","type":"debug","z":"da97d878.d3d728","name":"","active":true,"tosidebar":true,"console":false,"tostatus":false,"complete":"false","statusVal":"","statusType":"auto","x":790,"y":2620,"wires":[]},{"id":"17378eab49b3eb17","type":"debug","z":"da97d878.d3d728","name":"","active":true,"tosidebar":true,"console":false,"tostatus":false,"complete":"false","statusVal":"","statusType":"auto","x":1010,"y":2620,"wires":[]},{"id":"f72a94e6.10d108","type":"ui_group","name":"Temperatur","tab":"567fd079.3e213","order":1,"disp":true,"width":"6","collapse":false},{"id":"1f7575cc.59429a","type":"influxdb","hostname":"influxdb","port":"8086","protocol":"http","database":"sensordb","name":"","usetls":false,"tls":"","influxdbVersion":"2.0","url":"http://influxdb2:8086","timeout":"","rejectUnauthorized":false},{"id":"567fd079.3e213","type":"ui_tab","name":"Sensoren","icon":"dashboard","order":1,"disabled":false,"hidden":false}]
The query from the example that works is:
import "math"

from(bucket:"sensordb")
  |> range(start: -30h)
  |> filter(fn: (r) =>
      r._measurement == "BME280" and
      r._field == "temp")
  |> aggregateWindow(every: 5m, fn: mean, createEmpty: false)
  |> map(fn: (r) => ({ r with _value: math.round(x: r._value) }))
and the output is something like this (removed elements from the array):
[
    {
        "result": "_result",
        "table": 0,
        "_field": "temp",
        "_measurement": "BME280",
        "_start": "2025-03-04T06:37:20.859943864Z",
        "_stop": "2025-03-04T07:37:20.859943864Z",
        "_time": "2025-03-04T06:40:00Z",
        "_value": 23
    },
    {
        "result": "_result",
        "table": 0,
        "_field": "temp",
        "_measurement": "BME280",
        "_start": "2025-03-04T06:37:20.859943864Z",
        "_stop": "2025-03-04T07:37:20.859943864Z",
        "_time": "2025-03-04T06:45:00Z",
        "_value": 24
    }
]
The conversion for the graph to show that is done by JSONATA:
[
   {
       "series": [$.payload[0]._field],
       "labels": [""],
       "data": [
           $[].[
               $.payload.(
                   $._value != null ? {"x": $toMillis(_time),"y": _value}
                )
            ]
        ]
    }
]
and results in something like this:
[
    {
        "series": [
            "temp"
        ],
        "labels": [
            ""
        ],
        "data": [
            [
                {
                    "x": 1741070400000,
                    "y": 23
                },
                {
                    "x": 1741070700000,
                    "y": 24
                }
        ]
    }
]
Let's assume I have multiple such time series of temperature and would like to show them in one graph.
With InfluxDB v1 I would simply concatenate the queries (which looked more like SQL):
SELECT round(mean("temp")*100)/100 AS "BME280" FROM "example" WHERE sensor = 'BME280' AND time > now() - 30h GROUP BY time(5m) FILL(null);
SELECT round(mean("temp")*100)/100 AS "BME280_2" FROM "example" WHERE sensor = 'BME280_2' AND time > now() - 30h GROUP BY time(5m) FILL(null);
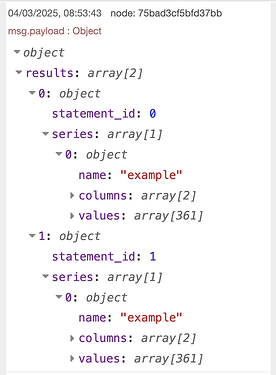
The result is an object with attribute results and results is an array with as much elements as there are queries:
Those I would re-arrange with JSONATA and show them all together in a chart:
However, with InfluxDB v2 I cannot find a way to combine multiple queries.
Also the time series do not have an equal time (some get data every 5sec and others only get data every minute or so), hence a simple join seems not to work.
Probably, I could create some flow with multiple single queries, collect them in a buffer and once all queries finished, combine all into one message, but that seems neither very efficient nor elegant.
Maybe one of you has a better idea or knows how to combine queries?
Versions
NodeRed v4.0.9
InfluxDB v2.7.11


