Iot_datasource is not showing the graph

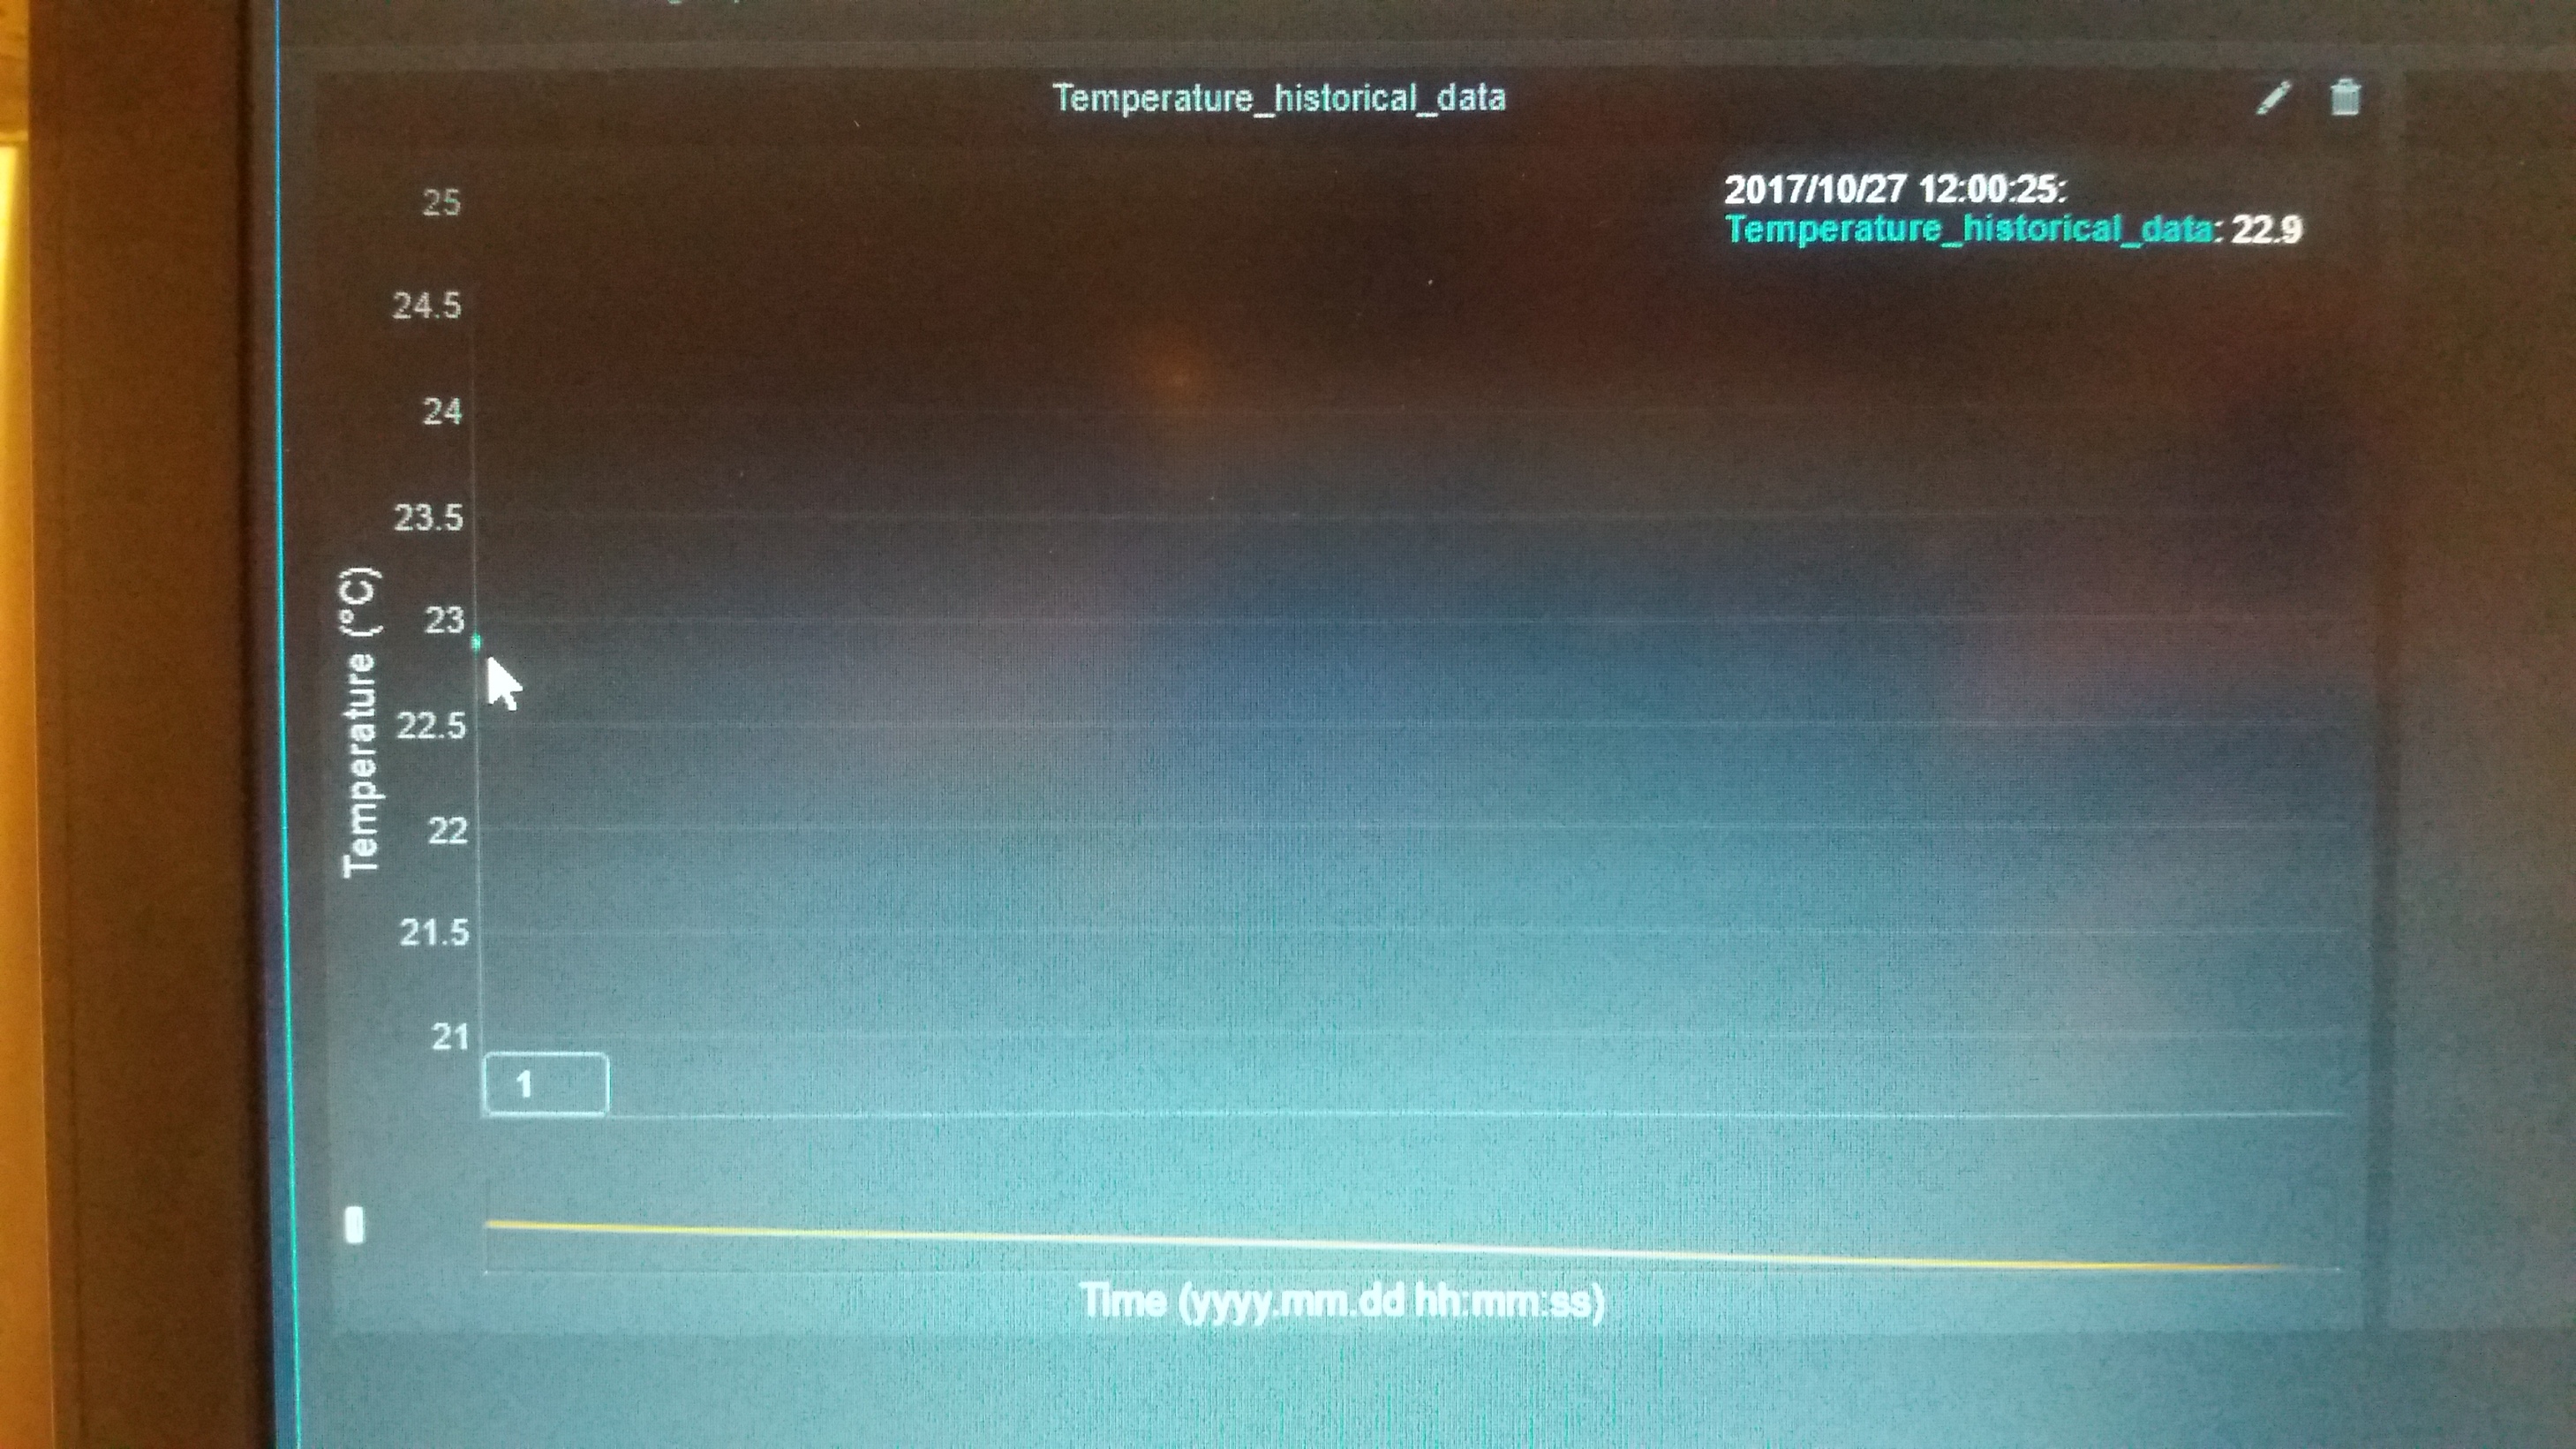
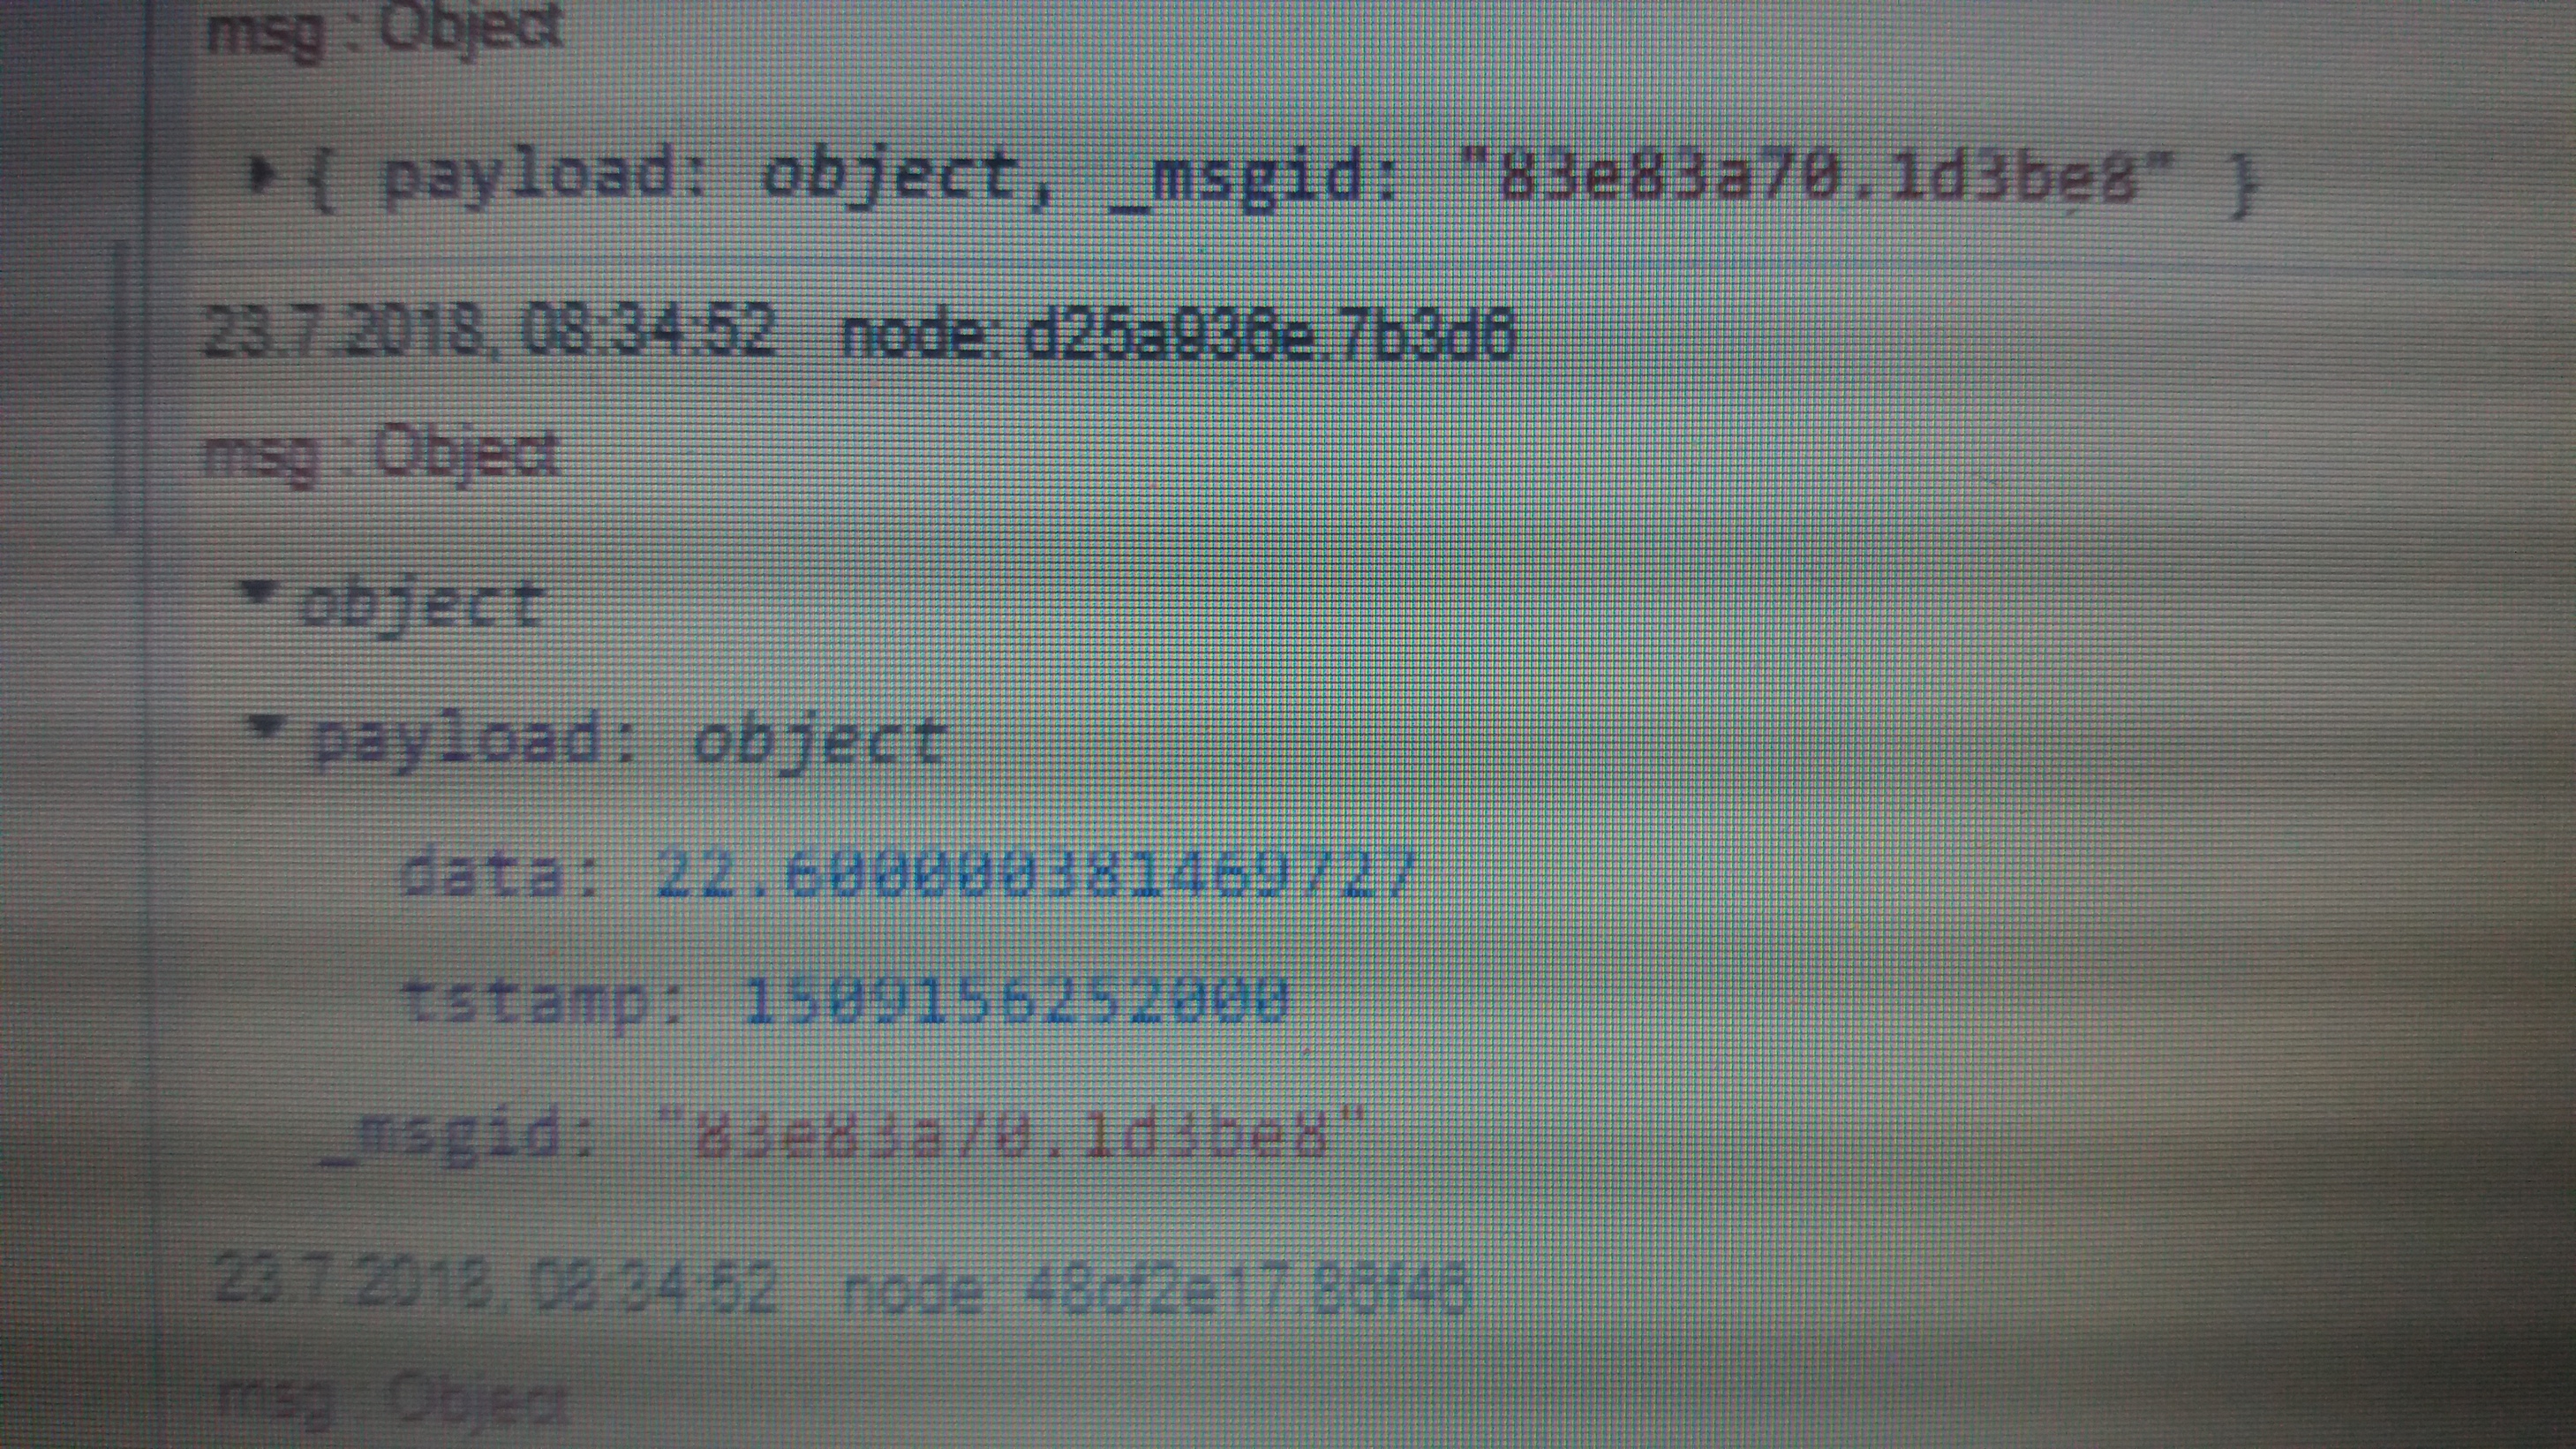
I have historical data stored in a SQL Database as Datum in the format (2017.10.27 12:00:25) and the corresponding Temp in the format (26.55). I am using the node iot_datasourse to show the data and the debug message shows the time and the corresponding temperature, but the dashboard doesn't show any graphic. The flow nodes are as follows, I would appreciate some help

[{"id":"280b51a9.1d20ee","type":"iot-datasource","z":"a287c70.b313638","name":"Temperature_historical_data","tstampField":"tstamp","dataField":"data","disableDiscover":false,"x":800,"y":420,"wires":[["d2f6ac7.9847f5"]]},{"id":"174ee565.e02b2b","type":"function","z":"a287c70.b313638","name":"Temp","func":"var p =msg.payload;\n\nfor(var i=0;i<p.length;i++){\n var dUnix =Date.parse(p[i].Datum);\n node.send({payload:{data:p[i].Temp, tstamp:dUnix}});\n}\nreturn;","outputs":1,"noerr":0,"x":590,"y":420,"wires":[["280b51a9.1d20ee","5f0d558f.04310c"]]},{"id":"a74a3ded.a929e","type":"MSSQL","z":"a287c70.b313638","mssqlCN":"e1823c68.173aa","name":"database_sql","query":"","outField":"payload","x":430,"y":420,"wires":[["174ee565.e02b2b"]]},{"id":"542c5d2d.ed21e4","type":"inject","z":"a287c70.b313638","name":"","topic":"","payload":"SELECT * FROM [test].[Temp]","payloadType":"str","repeat":"","crontab":"","once":false,"onceDelay":0.1,"x":210,"y":420,"wires":[["a74a3ded.a929e"]]},{"id":"5f0d558f.04310c","type":"debug","z":"a287c70.b313638","name":"","active":true,"tosidebar":true,"console":false,"tostatus":false,"complete":"false","x":770,"y":340,"wires":[]},{"id":"d2f6ac7.9847f5","type":"debug","z":"a287c70.b313638","name":"","active":true,"tosidebar":true,"console":false,"tostatus":false,"complete":"false","x":1010,"y":340,"wires":[]},{"id":"e1823c68.173aa","type":"MSSQL-CN","z":"","name":"SQL","server":"localhost","encyption":true,"database":"test"}]

I can't find any reference to an iot_datasource node (flows.nodered.org appears to be down which doesn't help). Can you provide a link to the node on npm?

Is that node supposed to show something on the dashboard? If not then I don't see a dashboard node in the flow.

It's this node: node-red-contrib-graphs

This node creates a different dashboard window and when we click "create new chart" it creates the charts we configured, but in my case it doesn't show the graphic, as shown in the photo...

I haven't used that node, but have you tried it using one of the example flows given?

also, seeing how that node hasn't been updated in over two years, are you also using the node-red-node-dashboard? If so there may be a conflict.

I tried the examples and the graphics appear with no problems. I am only using the dashboard of the datasource node. I think my problem is in the function in the conversion of the date (2017.10.27 12:00:25) into a number because I changed the function like follows below and now I have this weird graphic and the point in blue is the first value of my temperature and the respective date. If you have any suggestions other than "Date.parse()" to convert the date to a number I would appreciate.

[{"id":"280b51a9.1d20ee","type":"iot-datasource","z":"a287c70.b313638","name":"Temperature_historical_data","tstampField":"tstamp","dataField":"data","disableDiscover":false,"x":800,"y":420,"wires":[["d2f6ac7.9847f5"]]},{"id":"174ee565.e02b2b","type":"function","z":"a287c70.b313638","name":"Temp","func":"var p =msg.payload;\n\nfor(var i=0;i<p.length;i++){\n node.send({payload:{data:p[i].Temp, tstamp:p[i].Datum}});\n}\nreturn;","outputs":1,"noerr":0,"x":590,"y":420,"wires":[["280b51a9.1d20ee","5f0d558f.04310c"]]},{"id":"a74a3ded.a929e","type":"MSSQL","z":"a287c70.b313638","mssqlCN":"e1823c68.173aa","name":"database_sql","query":"","outField":"payload","x":430,"y":420,"wires":[["174ee565.e02b2b"]]},{"id":"542c5d2d.ed21e4","type":"inject","z":"a287c70.b313638","name":"","topic":"","payload":"SELECT * FROM [test].[Temp]","payloadType":"str","repeat":"","crontab":"","once":false,"onceDelay":0.1,"x":210,"y":420,"wires":[["a74a3ded.a929e"]]},{"id":"5f0d558f.04310c","type":"debug","z":"a287c70.b313638","name":"","active":true,"tosidebar":true,"console":false,"tostatus":false,"complete":"false","x":770,"y":340,"wires":},{"id":"d2f6ac7.9847f5","type":"debug","z":"a287c70.b313638","name":"","active":true,"tosidebar":true,"console":false,"tostatus":false,"complete":"false","x":1010,"y":340,"wires":},{"id":"e1823c68.173aa","type":"MSSQL-CN","z":"","name":"SQL","server":"localhost","encyption":true,"database":"test"}]

Feed a data point from the example into a debug node and show us what it looks like, then feed your data in and show us what that looks like. In fact first compare them and see if you can see the problem. You mention the date but you have not explained what it should be and what you have. Remember possibly no-one here has used that node.

The timestamp of the ramdom numbers is with the Time in this format

20180723_082626

My timestamp is in the same format as the example, but still no graph.

Looks ok to me. Out of ideas, sorry.

If you open the browser's dev console (F12), are there any javascript errors on the graph page? Also, can you post the node-red console log output that is shown when node-red starts up? That will clearly show us what versions of code are being used...