Andrei
7
What you want is perfectly doable and will generate a nice bar chart indeed.
In order to populate the x-axis you will need to format the dataset to load time values as the "labels".
For instance, this msg.payload
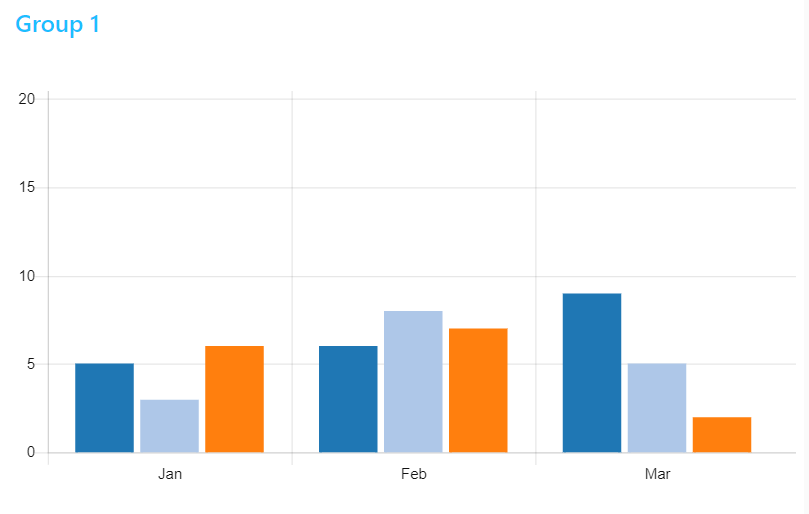
[{
    "series": ["X", "Y", "Z" ],
    "data": [ [5,6,9], [3,8,5], [6,7,2] ],
    "labels": [ "Jan", "Feb", "Mar" ]
}]
Will generate this bar chart
Another good example is the one that @hotNipi posted here: