I am trying to customize the x axis labels on the chart widget.
Can I get an example of how I would populate the X-Axis Input Text Box on the Chart widget in order to set each label along the x axis?

Thanks...
I am trying to customize the x axis labels on the chart widget.
Can I get an example of how I would populate the X-Axis Input Text Box on the Chart widget in order to set each label along the x axis?
Thanks...
As per the info box on the right - The axis labels can be formatted using a Moment.js time formatted string.
Well, I probably forgot to mention that I do not want any time labels on the x-axis.
In my case integer values like 0,10,20,30,40..... for the x-axis labels. How would I set the custom labels for such?
Thanks...
Many threads about this kind of topic you can find here. Latest: https://discourse.nodered.org/t/configurable-x-axis-bar-graph-per-time-hour-hour/6373
Well, I tried several ways of entering the x-axis labels, but I could not get them to work the way I need.
So, here is an image of what I want to accomplish. Can this be done, if so, how do I enter the correct format in the chart widget?

Thanks...
Any chance of sharing a copy of the input data ?
Sure, here is the input to the chart widget.
var data = [{"x":0,"y":msg.payload[0]},{"x":1,"y":msg.payload[1]},{"x":2,"y":msg.payload[2]},{"x":3,"y":msg.payload[3]},{"x":4,"y":msg.payload[4]},{"x":5,"y":msg.payload[5]},{"x":6,"y":msg.payload[6]},{"x":7,"y":msg.payload[7]},{"x":8,"y":msg.payload[8]},{"x":9,"y":msg.payload[9]},
            {"x":10,"y":msg.payload[10]},{"x":11,"y":msg.payload[11]},{"x":12,"y":msg.payload[12]},{"x":13,"y":msg.payload[13]},{"x":14,"y":msg.payload[14]},{"x":15,"y":msg.payload[15]},{"x":16,"y":msg.payload[16]},{"x":17,"y":msg.payload[17]},{"x":18,"y":msg.payload[18]},{"x":19,"y":msg.payload[19]},
            {"x":20,"y":msg.payload[20]},{"x":21,"y":msg.payload[21]},{"x":22,"y":msg.payload[22]},{"x":23,"y":msg.payload[23]},{"x":24,"y":msg.payload[24]},{"x":25,"y":msg.payload[25]},{"x":26,"y":msg.payload[26]},{"x":27,"y":msg.payload[27]},{"x":28,"y":msg.payload[28]},{"x":29,"y":msg.payload[29]},
            {"x":30,"y":msg.payload[30]},{"x":31,"y":msg.payload[31]},{"x":32,"y":msg.payload[32]},{"x":33,"y":msg.payload[33]},{"x":34,"y":msg.payload[34]},{"x":35,"y":msg.payload[35]},{"x":36,"y":msg.payload[36]},{"x":37,"y":msg.payload[37]},{"x":38,"y":msg.payload[38]},{"x":39,"y":msg.payload[39]},
            {"x":40,"y":msg.payload[40]},{"x":41,"y":msg.payload[41]},{"x":42,"y":msg.payload[42]},{"x":43,"y":msg.payload[43]},{"x":44,"y":msg.payload[44]},{"x":45,"y":msg.payload[45]},{"x":46,"y":msg.payload[46]},{"x":47,"y":msg.payload[47]},{"x":48,"y":msg.payload[48]},{"x":49,"y":msg.payload[49]},
            {"x":50,"y":msg.payload[50]},{"x":51,"y":msg.payload[51]},{"x":52,"y":msg.payload[52]},{"x":53,"y":msg.payload[53]},{"x":54,"y":msg.payload[54]},{"x":55,"y":msg.payload[55]},{"x":56,"y":msg.payload[56]},{"x":57,"y":msg.payload[57]},{"x":58,"y":msg.payload[58]},{"x":59,"y":msg.payload[59]},
            {"x":60,"y":msg.payload[60]},{"x":61,"y":msg.payload[61]},{"x":62,"y":msg.payload[62]},{"x":63,"y":msg.payload[63]}];

msg.payload = [{
  "series": ["A"],
  "data": [data],
  "labels": [ ]
}];
msg.topic = "Data set 1";
return msg;
Thanks...
Try custom format SSS
(though there is a bug I have fixed in master (not yet on npm) that may prevent it working)


Tried inputting SSS, as you suggest, but has no effect...
-Thanks
Oh, wait, it does show up, however, not scaled - just as data points from 0-63. My scale is 0-100, but with 64 data points. How do I adjust scaling?
Thanks...
not sure what you mean ?
screenshot ?
This should make sense, basically there are 64 data points on the x-axis, but the scale should go from 0-100 instead of 0-63.

Errr - the data you supplied only has x going from 0 to 63... you need to scale that to 100 if you want x to be 100
var data = [{"x":0,"y":msg.payload[0]}, ... ,{"x":63,"y":msg.payload[63]}];Just to clarify that, in case you don't get it, the last element should be something like
{"x":100,"y":msg.payload[63]}
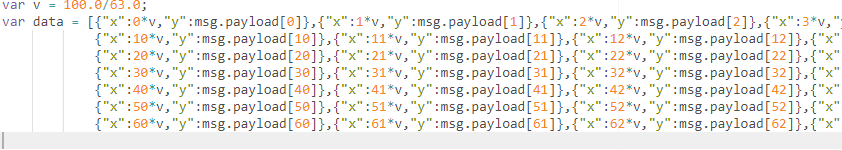
How about this, instead of X in integers from 0-64, X as decimal 1.5625 from 0-64?
var data = [{"x":0,"y":msg.payload[0]} ,{"x"1.5625,"y":msg.payload[1]}, {"x"3.125,"y":msg.payload[2]},...{"x":100,"y":msg.payload[63]}];
What do you think?
Isn't it more a matter of whether it does what you want rather than what we think about it?
That is awesome!! if i want to put strings on x axis someone know how can i do it? And a title on x-axis ? @tcontrada @dceejay
Copyright OpenJS Foundation and Node-RED contributors. All rights reserved. The OpenJS Foundation has registered trademarks and uses trademarks. For a list of trademarks of the OpenJS Foundation, please see our Trademark Policy and Trademark List. Trademarks and logos not indicated on the list of OpenJS Foundation trademarks are trademarks™ or registered® trademarks of their respective holders. Use of them does not imply any affiliation with or endorsement by them.
The OpenJS Foundation | Terms of Use | Privacy Policy | OpenJS Foundation Bylaws | Trademark Policy | Trademark List | Cookie Policy