Local weather group for Dashboard

You might want to check what ports are allowed through your work firewall.

SSH is pretty strong protection as long as you move its external port from the default 22 to something else (e.g. 9090 or 9022) so that you don't keep getting bots trying to break in. Also worth setting up certificate based access control and disabling id/password login.

I have already changed the port for SSH and have quite strong passwords and login on my Pi but don't know anything about certificate based access.
That is new to me and I wouldn't know how to do it.
Can it be implemented remotely?

My system is only a test or play so if anything gets changed / wiped etc, I won't lose anything that can't be replaced anyway, so not that bothered but it would be nice to practice and try to put in place these security measures.

Thanks
Martin

Here are a few articles that may help. Don't worry, I can never remember how to do it either. Just work through an example steadily though and you should be fine.

Search results

  1. Passwordless SSH access - Raspberry Pi Documentation

To generate new SSH keys enter the following command: ... RSA or DSA identities to the authentication agent ssh-agent then execute the following command:

  1. How to setup SSH Keys on the Raspberry Pi – Kamil's Lab

www.kamilslab.com/2016/12/17/how-to-set-up-ssh-keys-on-the-raspberry-pi/

17 Dec 2016 ... SSH Keys allow you to login to your server without a password and the client and server ... I will assume you are using a Linux based computer.

  1. How to Setup Raspberry Pi SSH Keys for Authentication - Pi My Life ...

28 Mar 2019 ... Using SSH Keys for authentication is an excellent way of securing your Raspberry Pi as only someone with the private SSH key will be able to ...

  1. How to Set Up Keys and Disable Password Login for ssh on your ...

18 Sep 2012 ... This has been done, based on a fresh install of Raspbian Wheezy 16 Aug 2012 ... In the latest Raspbian, (August 2012) public key ssh login is ...

  1. Setting up SSH Keys on the Raspberry Pi - Raspberry Pi Spy

5 Feb 2019 ... This guide will allow you to login to your Pi using SSH keys but the standard username/password approach will still work. Make sure you have ...

Thanks very much.
It's a bit late in the day at the moment but will have a good look at the links tomorrow.

Thanks again
Martin

Well, I'm now home after a very long stint away at work.

I have tested my dust sensor which seems to work well although I expected the serial output from it to be in plain English, however it turns out to be HEX, but found a small sketch for the Arduino to test / convert to English and looks good.

I have also got a couple of ATTiny85's which I want to use for the task of converting the HEX to a readable format before passing to Node-Red on the RPi. What I thought would be an easy task is proving to be difficult mainly due to reading the serial data into a buffer and then having problems reading out from that buffer. Serial ports, i/p and o/p are working fine so I'm half way there. I don't really want to waste an Arduino on such a small task.
I could probably use Node-Red to convert and format the data from Hex but I would like to try the ATTiny85 first.
As I am now getting a fair few sensors, I want to split them up, get the wind speed and direction high up, the light, temp, humidity and pressure on the rear of the house in the shade, dust sensor and rain gauge on the rear fence and also include some internal sensors too.
This is presenting me with a problem. When everything was connected to a single device this would send data to the RPi using a simple serial format over Bluetooth, now with everything split, each section needs its own device and therefore has to send its on serial string to the RPi. The problem is what to use!
Does anyone have any ideas for sending data from multiple sources to the RPi, I figure at least 4 different sources. (Wirelessly).
Also, does anyone have any experience with the ATTiny85 that could possibly help.

Thanks all

Well, with the exception of your stipulation of using the ATTiny85's, I think that most of us would immediately have suggested using ESP8266's which have built-in WiFi and can still be programmed from the Arduino IDE.

Old-school though would be a 433MHz module (or equivalent for your region). But by the time you've purchased some wireless boards and hooked everything up, it might still be cheaper and easier to switch to ESP8266's.

Anyway, assuming you can find a way to get output to a network, MQTT is the next step, simply direct all of the device output straight to MQTT with each device using its own topic. Typically, I send raw output direct to DEVICES/<devId>/Temperature or whatever so that it is easy for Node-RED to listen either to all devices for a single measurement type DEVICES/+/Temperature or to listen to a single device, all measurements DEVICES/<devId>/#.

Hi Julian,

Thanks for the reply.

I do have a few ESP8266's lying around in various types, mostly D1 Mini Pro's as I have made a few projects in the past with these and in the early stages of my weather monitor I did experiment with them using MQTT.

I suppose really it is the obvious choice but I always feel it is a waste to have something so powerful to just read the temperature, even though they were costing me less than £2 each!

I previously damaged one by using some small solar panels and Li-Ion battery. I didn't use any battery management so after a week or so I completely killed the battery by having a too high output voltage, this of course caused over voltage and damage to the D1 Mini Pro analogue input, (I think I set my potential divider for a maximum input of 8 volts) as the input was monitoring battery voltage!

I wasn't too bothered as it was just experimental, which is what its all about.

I'm now thinking of using an ESP32 for the main unit as it has more analogue inputs and a built-in Li-Ion battery manager. (I paid about £2.50 for it but prices seemed to have rocketed recently for some reason).

I was just hoping to make use of some ATTiny85 as I have a couple to play with.

Although I had MQTT running before, I didn't really understand what I was doing, it was just using sketches from the internet and happened to work, so looks like I shall be looking more into that.

On a side note, I have been using Node-Red Dashboard to display the data but just started looking into InfluxDB to record it (was just writing a .csv file before) and Grafana for display. It's looking not bad so far!

Thanks

Martin

1 Like

Yup, that's what I use as the power management via USB is so easy. Had lots of troubles with power before I discovered these. Made me realise just how limited my electronics knowledge is.

Oops! See my comment above :wink: A salient lesson for us all.

Ha, well that is nearer to a Pi Zero in power so that would run a small village :slight_smile:

I only have 1 which is inside an M5 Stack so comes with screen, buttons and battery. Nice unit to play with and will eventually make a nice, family friendly little controller/display around the house.

Yes, the best thing is to leave it running and then you will soon find yourself seeing practical uses for it. Then you wont know what you did without it. It takes up such little resource if you use Mosquitto on a Pi that you won't notice it.

Yup, agreed. A really nice combination that I use for the more complex, longer-term monitoring. Nice to be able to see trends between outside temperature & humidity and inside. Combine with heating usage to see heating/cooling trends. Also use it (perhaps with the help of Telegraf) to do long-term monitoring of your Pi or other servers.

Of course, for really impressive custom dashboards, you might want to think about uibuilder. :wink:

Well, after a few days of messing with MQTT etc. I’m a little stuck.
I am using an ESP8266 to send data from the dust sensor after it has been formatted into a readable format.
I then publish each piece of information (there are 11 values) to a topic which has 1 value per topic.
In Node-Red I can read the data, but I am having to use an MQTT node for each topic then I can feed the data directly to a graph. This bit works great, I can feed more than one piece of data to a graph if I require.

The bit I cannot do is save the data to an InfluxDB database. It will only write one value even if I connect all the data from each MQTT node, it will record all the data but under one the same field called ‘value’.

This shows some database records, there are three topics coming in but all go under the same value.
time............................... value


1559348651541415774 1.00
1559348651541744362 3.00
1559348652372074809 3.00
1559348659187244008 1.00
1559348659198512276 2.00
1559348659198514619 2.00
1559348669826310651 2.00
1559348669884900859 2.00
1559348669885329343 2.00

Of course, this also means I cannot use the data in Grafan either.

I think I know the problem and the solution, but I cannot get a solution to work.
I believe I need to format the data as a JSON script, this can be done either on the EPS8266 and sent as JSON over MQTT OR combine the data in Node-Red with a Function node and output JSON.

This is my problem now. Days of trying both options, going through videos on the internet, following tutorials, getting code and adjusting it for my data and nothing is working so far, I have basically disappeared up my own back-side going round and round.

On the ESP side, the closest I have come is using ‘ArduinoJson.h’ but then I get errors telling me to adjust the code for version 6 which I have tried but my understanding leaves me unable to figure that one out.

On the Node-Red side, I have tried so many ways of combining the data, but my limited knowledge leaves me randomly changing colons, commas, quotes, and all manner of things, basically clutching at straws.

So, if anyone can point me in the right direction I would appreciate the assistance, just a hint or a link to something that is current would be a start.

Here are a three of the outputs from the MQTT nodes:
{"topic":"particle/env/PM10","payload":"2.00","qos":0,"retain":false,"_topic":"particle/env/PM10","_msgid":"10d6f9c4.971656"}

{"topic":"particle/standard/PM25","payload":"3.00","qos":0,"retain":false,"_topic":"particle/standard/PM25","_msgid":"801dd316.a890c"}

{"topic":"particle/standard/PM100","payload":"3.00","qos":0,"retain":false,"_topic":"particle/standard/PM100","_msgid":"41e0192d.dd5308"}

How could I combine them?

Thanks

First off you can have one MQTT-in node passing to a switch. Just use a topic of particle/#. If you don't know about using single level and multi-level wildcards in your topics, you should go read MQTT Topics, Wildcards, & Best Practices – MQTT Essentials: Part 5 - actually read the enrite series.

terminology: you mean a JSON string or a javascript object

I would work backwards. setup an inject node and an influx node and figure out how to store data in the influx database. Remember Influx is not like SQL. While there are similarities, there are differences and I'm trying to wrap my head around this too but this might help: InfluxDB schema design and data layout | InfluxDB OSS v1 Documentation

Once you can create a inject node with test data in the format you want/need that inserts successfully into the database, you can now work on formating the data from the sensor into that structure.

I hope this gives you some help.

Update - take a look at this thread: Changing a payload.obects field name

Hi Paul,

Thank you for the reply.

I do have a working flow taking data directly from the 'OpenWeatherMap' node and going directly to an InfluxDB node, which works perfectly. (There are other nodes coming off them to other graphs and gauges on the Node Red dashboard).
The structure of that is like this...
{"_msgid":"b004ccb4.51f3f","topic":"","payload":{"weather":"Rain","detail":"moderate rain","icon":"10d","tempk":291.6,"tempc":18.4,"temp_maxc":20,"temp_minc":16.6,"humidity":72,"......... etc

So, I have been looking at this structure and trying to mimic it, this is where I am failing badly.

When using the wildcard on the MQTT node 'particle/#' and take it to the InfluxDB database, then I get the same thing, everything is recorded but under still under one value.

Time _______________ Value
1559587458347197296 0.00
1559587468997830053 1.00
1559587469102725981 1.00
1559587469104598577 1.00
1559587469105442636 1.00
1559587469105462480 1.00
1559587469106944193 1.00
1559587469107932001 342.00
1559587469108782154 98.00
1559587469110881833 10.00
1559587469111741882 0.00
1559587469111741986 0.00
1559587469113259271 0.00

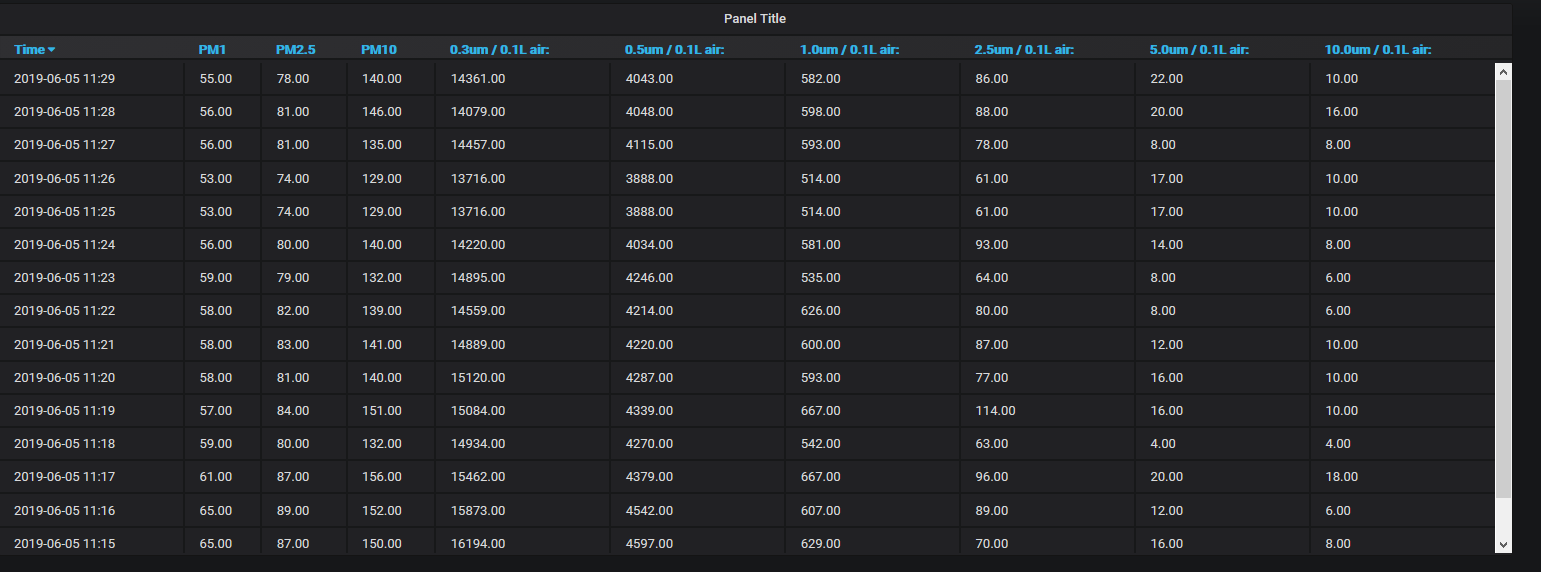
What I would like is to see something like this.....

Time .............................. PM 1...... PM 2.5......PM 10.... 0.3um..... 0.5um..... etc....
1559587469107932001... 0.00.........1.00..........1.00.........342..........98........... etc...

(Ignore the dots, spaces don't register on here for some reason)

Anyway this is why I am thinking that I need to change the format and some how have the ALL the data in one message, hence the JSON string (I stand corrected about script/sting :slight_smile:) .

I will be adding more sensors to the ESP and adding those to the string too, but once I crack this, then adding more should not be a problem.

Ah well, another late night..

EDIT.....
Just for info, this is the part in my sketch to publish the data..

char pm10string[8];
dtostrf(data.pm10_standard, 1, 2, pm10string);
client.publish("particle/standard/PM10", pm10string);

char pm25string[8];
dtostrf(data.pm25_standard, 1, 2, pm25string);
client.publish("particle/standard/PM25", pm25string);

char pm100string[8];
dtostrf(data.pm100_standard, 1, 2, pm100string);
client.publish("particle/standard/PM100", pm100string);

char pm10string_env[8];
dtostrf(data.pm10_env, 1, 2, pm10string_env);
client.publish("particle/env/PM10", pm10string_env);

char pm25string_env[8];
dtostrf(data.pm25_env, 1, 2, pm25string_env);
client.publish("particle/env/PM25", pm25string_env);

char pm100string_env[8];
dtostrf(data.pm100_env, 1, 2, pm100string_env);
client.publish("particle/env/PM100", pm100string_env);

char p03[8];
dtostrf(data.particles_03um, 1, 2, p03);
client.publish("particle/0.3", p03);

char p05[8];
dtostrf(data.particles_05um, 1, 2, p05);
client.publish("particle/0.5", p05);

char p10[8];
dtostrf(data.particles_10um, 1, 2, p10);
client.publish("particle/1.0", p10);

char p25[8];
dtostrf(data.particles_25um, 1, 2, p25);
client.publish("particle/2.5", p25);

char p50[8];
dtostrf(data.particles_50um, 1, 2, p50);
client.publish("particle/5.0", p50);

char p100[8];
dtostrf(data.particles_100um, 1, 2, p100);
client.publish("particle/10.0", p100);

Thanks

Martin

first off I don't beleive you need to add the time. As you add a measurement, Influx will automatically add the time. You want format your data like @ghayne showed it the thread I pointed you to.

1 Like

Hi Paul,

I didn't add the time, this is from the Influx data base, as you said, it adds the time automatically.
I agree, that is the format I want, but just can't get it from the ESP.
The client.publish format is
Client.publish("myTopic", "myMessage");
hence why I am having to send each part individually and why I was also trying to combine them in Node-Red instead!
I'll keep at it :slight_smile:

What are you using on the ESP to generate the message - the Arduino IDE? or something else like ESPeasy?

Assuming it is a sketch, here is some code I use to send a JSON string of an javascript object to send data from a dht22 (temp and humidity) and the room, device type and device ID

  // form a JSON-formatted string:
  String msg1 = "{\"room\":\"";
  String msg2 = room;
  String msg3 = "\",\"device\":\"";
  String msg4 = device;
  String msg5 = "\",\"id\":\"";
  String msg6 = id;
  String msg7 = "\",\"temp\":\"";
  String msg8 = String(t);
  String msg9 = "\",\"humi\":\"";
  String msg10 = String(h);
  String msg11 ="\"}";
  String msg = msg1 + msg2 + msg3 + msg4 + msg5 + msg6 + msg7 + msg8 + msg9 + msg10 + msg11;
  // print it:
  
  long now = millis();
  if (now - lastMsg > 10000) {
    lastMsg = now;
    msg.trim();
    len = msg.length();
    msg.toCharArray(msg_to_send, len+1);
 
    if (debug) Serial.println(msg_to_send);

    client.publish(mqtt_topic, msg_to_send);
  }

maybe that will help

'''maybe that will help"

You cracked it. That is exactly what I have been trying to do.
Like I said, I knew the solution, but could not figure out how to do it.

This is my InfluxDB now....

time                PM1  PM10 PM2.5
----                ---  ---- -----
1559604094016963041 1.00 1.00 1.00
1559604104049339855 1.00 1.00 1.00
1559604114725680911 0.00 1.00 1.00
1559604124769391414 0.00 1.00 1.00
1559604135442806326 0.00 2.00 1.00
1559604145476904936 0.00 2.00 1.00

Excellent, thank you.
Off to bed now, almost 1am

2 Likes

Well, I have managed to get all the data saving to InfluxDB now but still having problems with Grafana.
I can display everything in a table but cannot graph anything. I beleive this is because all of the fields are stored as stings and not numbers, so next is to figure out how to either send them as numbers or still look to processing them in a function in Node-Red (which puts me back to square one!)
So, here I go, plodding on.
Thanks
Martin

Ah, yes. That is a bit of an issue. Really you should always make "values" numbers and if you want to keep strings, use "tags" along with the value. That works well with Grafana and is what I do.

Unfortunately, it isn't very easy at all to change the data-type once InfluxDB has started recording values. Best to drop the db and start again.

Dropping the database isn't a problem, I must have done it 50 times already whilst trying to figure things out.
I'm not recording data properly yet, still in the setting up stage.
I have split my MQTT data into 3 strings so I don't exceed the length limit. These are what I get directly from the MQTT node:

{"topic":"particle","payload":"{\"Standard_PM1\":\"170.00\",\"Standard_PM2.5\":\"229.00\",\"Standard_PM10\":\"261.00\"}","qos":0,"retain":false,"_topic":"particle","_msgid":"40c12ebb.28563"}
{"topic":"particle","payload":"{\"Environmental_PM1\":\"112.00\",\"Environmental_PM2.5\":\"\",\"Environmental_PM10\":\"173.00\"}","qos":0,"retain":false,"_topic":"particle","_msgid":"c947f80.5d0fa08"}
{"topic":"particle","payload":"{\"0.3um\":\"28026.00\",\"0.5um\":\"8083.00\",\"1.0um\":\"1126.00\",\"2.5um\":\"127.00\",\"5.0um\":\"30.00\",\"10.0um\":\"22.00\"}","qos":0,"retain":false,"_topic":"particle","_msgid":"c3ab82fb.ab9ef"}

Then it goes through a JSON node and the output is this:

{"topic":"particle","payload":{"Standard_PM1":"170.00","Standard_PM2.5":"230.00","Standard_PM10":"248.00"},"qos":0,"retain":false,"_topic":"particle","_msgid":"55802695.346448"}
{"topic":"particle","payload":{"Environmental_PM1":"112.00","Environmental_PM2.5":"","Environmental_PM10":"165.00"},"qos":0,"retain":false,"_topic":"particle","_msgid":"ee81030f.b722b"}
{"topic":"particle","payload":{"0.3um":"27972.00","0.5um":"8037.00","1.0um":"1105.00","2.5um":"120.00","5.0um":"14.00","10.0um":"6.00"},"qos":0,"retain":false,"_topic":"particle","_msgid":"c0f2d4fb.7d33c8"}

I can get my table as it shows the data as a string.

Would I be better off just sending a string with coma seperated values, then using node red to split the string, convert back to numbers THEN add the topic for each number, or would that be a step in the wrong direction?

Thanks
Martin

I've done it !

After completely messing up Node-Red and having to delete it from my Pi and re-install it, I started working on it again.
Parsing, simple as that.

This is the output from the MQTT node

{"topic":"particle","payload":"Standard_PM10=11.00;Standard_PM25=15.00;Standard_PM100=17.00;Env_PM10=11.00;Env_PM25=15.00;Env_PM100=17.00\n","qos":0,"retain":false,"_msgid":"6e021d3.b70b4e4"}

Then after parsing

{"topic":"rflink","payload":"Standard_PM10=11.00;Standard_PM25=15.00;Standard_PM100=17.00;Env_PM10=11.00;Env_PM25=15.00;Env_PM100=17.00","qos":0,"retain":false,"_msgid":"6e021d3.b70b4e4","msg433":{"Standard_PM10":"11.00","Standard_PM25":"15.00","Standard_PM100":"17.00","Env_PM10":"11.00","Env_PM25":"15.00","Env_PM100":"17.00"}}

And this is what I pass to InfluxDB

{"topic":"rflink","payload":{"Std_PM10":11,"Std_PM25":15,"Std_PM100":17,"Env_PM10":11,"Env_PM25":15,"Env_PM100":17},"qos":0,"retain":false,"_msgid":"6e021d3.b70b4e4","msg433":{"Standard_PM10":11,"Standard_PM25":15,"Standard_PM100":17,"Env_PM10":11,"Env_PM25":15,"Env_PM100":17}}

Resulting in this

time                Env_PM10 Env_PM100 Env_PM25  Std_PM10 Std_PM100 Std_PM25
----                -------- --------- -------- -------------- ------------- -------- --------- --------
1559920370483298922 13       22        20       22        20        13
1559920381026003493 13       21        19       21        19        13
1559920392119344158 13       19        17       19        17        13
1559920402652591845 13       19        17       19        17        13

Which I can now graph in Grafana until the cows come home
Still a few niggles to work out but well on the way now

1 Like

This is what happens when you start cooking in the kitchen even though the sensor is upstairs!

I intended to put this unit outside as part of my environmental monitor, but I may have to get another to use inside the home and make it into a portable device with an alarm and OLED display to monitor the air quality in the home.