Hello everyone!,
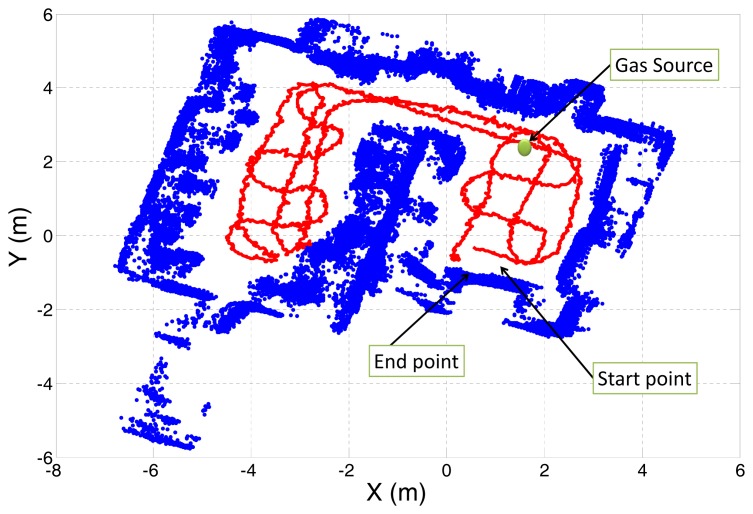
I'm new at node-red, so i'm sorry if am asking something wrong. i'd like to know if it's possible to make and show something like a X-Y map as the below picture.
And if you don't mind, could you give me directions about it?.
Thanks for read and regards!.
Martin
Your best friend is probably the library d3.js
Node-RED itself uses this library so it is already available out of the box (version 3.5.17).
How do you generate the dataset for the visualization ? Is it dynamic , real-time or pre stored in a database?
Hello Andrei, thanks for your reply. About the visualization, am taking some gps coordinates and i'd like to see it as a tracking. So i guess it may be draw some points and trace path.
i don't knew that node-red comes with something like that library, i guess it may be use like an ui< template>?
Hi, the library is used internally by Node-RED. The rectangle nodes you see in the editor, for instance, are drawn with the help of D3.js.
Indeed, if you want to use D3.js then you will use the UI template node.
Your use case is to plot GPS data in a map, so I recommend to check this pre-existing node:
Hello, wow!, that looks great, i guess it may be what i needed!!. gonna look it. thanks so much!!