Hello,
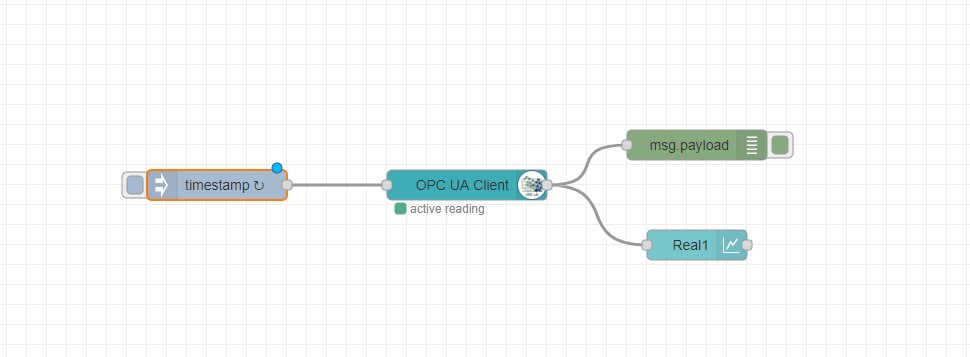
I have installed Node-Red in a Docker on a PLCnext controller (AXC F 2152 firmware 2020.6). Via OPC UA I want to create a line graph in Node-Red that is to be generated by a real variable. Unfortunately, the graph is only displayed as a line and I have seen that the time in Node-Red is not correct. Is there a way to set the current time in Node-Red?
When I installed Node-Red on my Windows PC I tried it again with the same code and it worked.
The same Node-Red version is installed on the PLCnext controller and the Windows PC. (v1.2.6)
Has anyone had a similar problem and can help me?
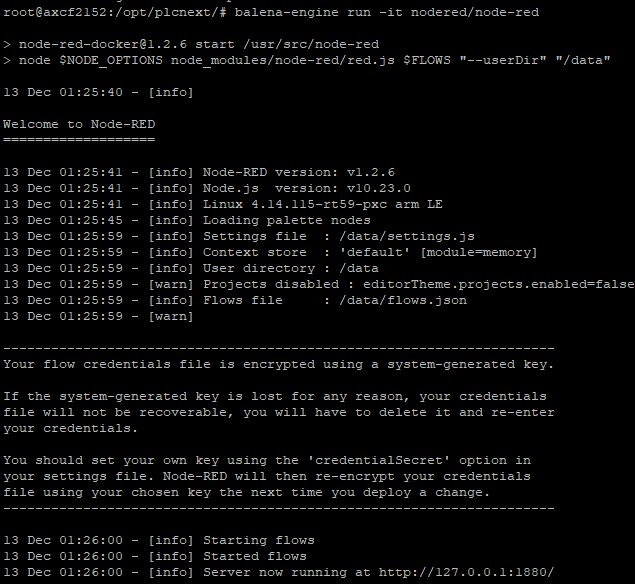
Also, I seem to remember hearing of the graph line problem before, what version of node-red, nodejs and node-red-dashboard are you running? If you can see the startup log for node red it will tell you all that. I don't know how to see that when running in a container.
Hello,
My Node-Red Version is v1.2.6 and my Dashboard version ui is 2.25.0 I don´t how read out node.js version the controller is based on linux software.
If you can open a terminal in the container then node -v should tell you.
You didn't answer the question about whether the system time is set correctly in the device, including the timezone. If you can open a terminal then what does the command date show?
Hello,
Sorry I didn't answer your questions, I was still looking for the right commands to open node-red in Docker. Unfortunately it doesn't know node -v and I can't enter any commands in Docker itself. When I enter (date) in the terminal of the controller, the correct date and time is displayed, but node-red Docker displays a different one. I have already posted a request in the PLCnext forum how to change the time in the Docker but I have no answer yet.
But back to the line graph in Node-Red, I discovered that the graph is correct when I delete the old one and replace it with a new one. But as soon as I close the ui (dashboard) and open it again, the graph is only shown as a straight line, see picture above.
Does anyone else have this problem and if so, how can I fix it?
I have cleared the entire cache in all browsers and tried it with Firefox, Google Chrome and Microsoft Edge and all have the same problem with the graph.
No time does not fit in Docker. I am in the time zone of Germany the time difference in the Node-Red Docker between the controller is 6 hours.
In that case you do need to get to the bottom of why the timestamp in the container is not correct. I don't know about that, but I note that in the docs for running node-red in docker it does talk about setting the timezone.


