Node-red-mcu-plugin v1.0: Integrating Node-RED MCU Edition into the Node-RED editor

Hi @ralphwetzel,
Finally back, after some hard labour on another contribution...

I was a bit suprised to see that my flow had stopped. The inject node should run every 5 seconds, but no messages anymore in my Debug panel.

  1. I had expected it would still be running, or is that an incorrect assumption?

  2. So I did a "reconnect to xsbug". The low showed that it is listening but I don't see anything in the log. Perhaps a dummy question, but what should I see in the console log when it says "listening". Or is that simply required to see anything in the Debug sidebar? I need to draw the entire route on paper, because I don't see the whole picture.

  3. Since I did not see anything, I tried to "build" with target "xsbug"*. Not sure what the difference is with "reconnect to xsbug"? Anyway - I assume because I executed step 1 already - I now got the following error:

    node:events:491
       throw er; // Unhandled 'error' event
       ^
    Error: listen EADDRINUSE: address already in use :::5002
     at Server.setupListenHandle [as _listen2] (node:net:1463:16)
     at listenInCluster (node:net:1511:12)
     at Server.listen (node:net:1599:7)
    
  4. So I have powered off/on my wt32 but I still don't messages appearing in my Debug sidebar. Do you (or others) have any idea what I might need to do to make it alive again?

Thanks!!!!

Hi!
I'm pretty sure your flow didn't stop - but the connection to the editor had been cut.

As I'm still getting the Terminated message when trying to use xsbug-log, I tested with (standard) xsbug ... and my wt32 runs fine.

Just remember to power-cycle the board after you've done Reconnect to xsbug. Without the power-cycle, nothing will happen...

EDIT: I applied the patch mentioned here (any reason this is not in the repo?) & made xsbug-log run as well. Same result: My WT32 runs fine...

Ah yes that sounds very logical. I hadn't thought about that scenario...
Thanks for clearing the fog in my head :wink:

So did I understand this correctly?

  • The xsdebug on my mcu sends messages via the serial connection (i.e. usb port) to my Debug node on the nodejs backend, and (via the standard Node-RED websocket channel) to my flow editor.
  • After a while the serial connection stops, so I don't see any messages anymore in my Debug sidebar.
  • When you see "Terminated" via xsbug-log that simply means that the serial connection is interrupted, although the flow on the mcu might still be running. But I don't see that it is running because my flow is a bit too simple at the moment: the inject node tries to send every 5 seconds a message into the serial connection (which fails).

That I don't understand to be honest. When I do "reconnect to xsb", this opens xsbug on my mcu so the serial connection is established? If so, I would expect the messages to be appearing again immediately afterwards in my sidebar? Why do I need to power cycle afterwards to see anything happen?

Do you mean that Andy has not added the patch to the mk file? If so, I don't know but I can ask him or create a pull request myself.

The MCU sends messages to a proxy server opened by the plugin. This proxy forwards those messages to xsbug(-log) and to the Node-RED runtime.

When you disconnect the serial connection, you don't see further messages.
When you re-connect the serial connection, the proxy & xsbug must be running to re-establish the message transmission.

Not really. The inject node sends a msg to a debug node. This happens on the MCU and works perfectly.
It's the (additional) data that the MCU transmits back to Node-RED (via the serial connection) to drive the editor display that is cut off.

Because the WT32 doesn't accept a hard reset via the serial interface.

The usual sequence is:

  1. Launch the proxy
  2. Open xsbug(-log)
  3. Hard reset the MCU
  4. MCU reports ready
  5. xsbug answers the MCU ready report with a command to open the debug channel
  6. MCU sends a lot of data

Step 4 only happens after a reset & Step 5 has to follow immediately.
No reset - no debug communication.

1 Like

Morning @ralphwetzel,
You might have meanwhile discovered that I have zero done in my limited spare time with mcu's in the past. So I will keep posting dumb questions :smiling_face:

Meanwhile I started to draw a cheat-sheet alike diagram, to visualize all of this to support my old brain. I will start soon a new discussion about, in an effort to make my diagram complete. Hopefully that will allow other noobs like me to start with mcu's via your plugin. And to show my appreciation for the time you spend on teaching me all of this...

If I understand correctly a hard reset is to clear the flash memory? So a soft reset is not enough? And why do I need to (hard) reset the mcu if I want to simply reconnect to the xsbug debugger to see the messages flowing again in my Debug sidebar?

Ah your plugin does all of this. I had supposed that the node-red-mcu module would do that, and your node-red-mcu-plugin was only a sidebar to control features from the node-red-mcu?

Do you mean it pushes the messages into the standard Node-RED websocket channel, so the messages automatically appear in the Debug sidebar? This is useful info for me to draw a complete picture...

And would really appreciate if you could explain a bit how the xsbug and xsbug-log work. I have stupid questions like these bubbling up in my head:

  • I install these tools on my Raspberry (as parts of the SDK). So they run on my RAspberry? But they have some counterpart on the MCU device, to which they communicate via the debug channel?
  • The xsbug is not usable on a headless pi, so I need to use xsbug-log. And you capture that log with your node-red-mcu-plugin and send it to your sidebar xterm shell? So I assume the xsbug-log is very limited compared to the xsbug?
  • Where is stuff like e.g. ESP-IDF located? That is is pushed somehow to the MCU I suppose and is triggered somehow?
  • Idem for things like mcconfig. You trigger those commands directly and not via the node-red-mcu I assume? And that triggers in turn builds on my MCU device? Not sure anymore where the node-red-mcu is positioned in my diagram...

Now time to start cleaning the house :face_with_spiral_eyes:

However you call it: The MCU has to restart. There's no way (that I know of - even after googling a lot) to restart the WT32 via the serial connection.

I tried to explain the WHY here:

The MCU will not send any data if not commanded to do so...

A MCU running a Moddable script (like node-red-mcu) - per default - talks to xsbug(-log). We've designed a way to put the plugin between these two to feedback data to the Node-RED system. The idea is to create as few overhead on the MCU as possible.

OK, you've asked :wink: : No. The msg - as it arrives at the input of the debug node on the MCU - is transmitted to the proxy and handed over to a debug node "running" in Node-RED. This debug node then simply does his job.

xsbug & xsbug-log are standard tools from the Moddable SDK.

The "counterpart" is data sent by the MCU. xsbug displays this data & has functionality to command the MCU.

Depends on your understanding of "limited". It's purpose is to display the log messages. It has no graphical UI, doesn't provide means to command the MCU by an operator, etc.

The ESP stuff if used to create the binary build for the MCU.

node-red-mcu is the equivalent to the Node-RED runtime.
mcconfig is the tool to build an MCU binary with the Moddable SDK.

The plugin runs mcconfig to build a binary that consists of the node-red-mcu runtime (source) and a lot of additional program sniplets (drivers & node implementations) and a lot of underlying code from the Moddable SDK & the ESP SDK... and then uses functionality from (e.g.) the ESP SDK to flash this on the MCU.

1 Like

@ralphwetzel,
Would like to know a few things before I can share my first draft cheat sheet diagram:

  1. Tried "reconnect to xsbug" now, but again got the error "address already in use :::5002". I see in your plugin code this:

    let proxy_port_mcu = 5004;
    let proxy_port_xsbug = 5002;
    

    Could you explain the usage of both ports on your proxy please?
    EDIT: Am I correct that xsbug is listening on port 5002 (both for the messages from the MCU and the messges your proxy sends to it), and that port 5004 is the port your proxy is listening to (for messages from the debug node running on the MCU)?

  2. I'm a bit stuck with your point 1 (i.e. "Launch the proxy"). How can I do that exactly via your sidebar?

  3. I always thought that a flow that is marked as 'moddable flow' would get a special treatment. Because the flow needs to run on the MCU and not on the NodeJs backend. Not sure how Node-RED has been fooled to accomplish this, because these are a.o. core nodes?

  4. Related to 3. If the deployed flow is not active (I assume) on the backend, how can your proxy route messages to the "running" Debug node instance on the backend. So I assume the Debug node is also running on the NodeJs backend, but not doing anything? :exploding_head:

  5. The log that you show in the xterm tabsheet of your plugin, is that the xs-bug.log?

  6. If I do "reconnect to xsbug" could you explain a bit what happens then under the cover? Trying to understand why I don't see anything in my terminal.

Thanks!!!

Without the plugin, the MCU & xsbug talk via 5002.
With the plugin, the MCU talks with the (proxy of the) plugin via 5002 & xsbug talks to the proxy via 5004.

You don't do this. In fact the whole sequence runs without user interference.

The deployed "MCU" flow is not de-activated. Its nodes (to be precise: the runtimes of its nodes) are replaced by an alternative implementation, dedicated to support what's necessary to interact with the flow on the MCU.

That's what you get when you run build.sh (this script is created in the working directory for every build run) from the command line.

The plugin calls mcconfig -t xsbug.

1 Like

Additional update: You (probably) don't see anything, because xsbug-log seems to have an issue. It doesn't seem to respect the -x parameter of mcconfig. I have to verify this a bit deeper...

1 Like

BTW just wanted to create a pull request to makes sure Andy's fix was merged, but I see now that Andy wrote in that post:

"Could you please test something for me and see if it helps? If it does, I'll work on a more proper fix."

So I am not going to create the pull-request, if it is not a proper fix...

I think my assumption is correct. xsbug-log isn't as mature as xsbug is.

#1: It doesn't respect the -x parameter:

>> IDF_PYTHON_ENV_PATH: /home/ralph/.espressif/python_env/idf4.4_py3.10_env
>> mcconfig -d -x localhost:5004 -l -m -p esp32/wt32_eth01 -t xsbug
/home/ralph/esp32/esp-idf/tools/idf.py
# starting xsbug
# xsbug-log listening on port 5002. ^C to exit.

#2: The command to terminate xsbug-log (prior to spawning a new instance) is missing in the scripts. That's why you get the Error: listen EADDRINUSE: address already in use :::5002 message.

That calls for some additional issue reports...

It was a proper fix ... if it was in the repo.

With my brand new cheat sheet I finally understand what you are talking about :rofl:

  • Do you want me to report those issues in their repo's?
  • So both xsbug and xsbug-log are told via the "-x" parameter to run on port 5004 (instead of their default port 5002, but that need to be fixed.
  • So we never terminate a running xsbug or xsbug-log via your sidebar. Last week I had accidentally started an xsbug, and afterwards my xs-bug log. Is that asking for troubles? Because I could imagine both would try to listen on the same port 5004? Or when you start when of both, should the script try to terminate automatically a running instance of xsbug OR xsbug-log?
  • Is it ok for you if I create an issue for your repo to show somehow the current status in your toolbar? I mean that you see in green "listening" or in red "stopped" or "terminated" or something like that? Because at the moment I don't really have an idea if the setup is currently ok.

Now off to the daily job...

You're the better reporter - as I'm not using xsbog-log for my daily doings...

Yes

The make script run by mcconfig usually terminates xsbug (to close dangling connections) and then re-starts it again. I can't find code logic in this script that does the same for xsbug-log. It has to be decided if it was even necessary / better to always call a termination command for both xsbug and xsbug-log to prevent errors in a situation you described...

You may do so - despite I can't confirm to implement that. The reasoning: The plugin only is aware of the presence of a running MCU when this MCU is sending data to be visualized in the editor. If it's data to be visualized, the user already gets an indication. I yet confirm that there's always a perception of uncertainty with an MCU...

1 Like

I have created a Github issue for this.

And another Github issue for this one.

@ralphwetzel,

Have been playing a bit to tweak the steps a bit more to fit my case. Every time I wanted to flash the wt32-eth01 I got this error:

Serial port /dev/ttyUSB0
Connecting......................................

A fatal error occurred: Failed to connect to ESP32: No serial data received.
For troubleshooting steps visit: https://docs.espressif.com/projects/esptool/en/latest/troubleshooting.html
CMake Error at run_serial_tool.cmake:56 (message):
  /home/pi/.espressif/python_env/idf4.4_py3.9_env/bin/python
  /home/pi/esp-idf/components/esptool_py/esptool/esptool.py --chip esp32
  failed

ninja failed with exit code 1
FAILED: CMakeFiles/flash 

Needed an extra power off/on of the mcu and then this problem is solved.

So it seems this will be my sequence:

  1. Put wt32-eth01 in programming mode (connect IO0 to GND)
  2. Build with target "Build"
  3. Power off/on the wt32-eth01 (to avoid the above error)
  4. Build with target "Deploy"
  5. Put wt32-eth01 in normal mode (disconnect IO0 from GND)
  6. Build with target "Xsbug" (with debug target "console")
  7. Power off/on the wt32-eth01 (to start receiving messages in xsbug-log)

Ok so finally I am ready for the real work. But not there yet:

Problem 1: Catch node

I added an MQTT-Out node, with an incorrect config node (i.e. it made sure the node is pointing to an unexisting MQTT broker). And I also added a Catch node:

image

Since the MQTT-Out node could not connect to the MQTT broker, the status was "connecting" as expected. And the xsbug-log showed correctly information about this problem:

# starting xsbug
PORT_USED=$(grep 'Serial port' /home/pi/Projects/moddable/build/tmp/esp32/wt32_eth01/debug/t5rg16s07b/xsProj-esp32/flashOutput | awk 'END{print($3)}'); \
cd /home/pi/Projects/moddable/tools/xsbug-log && node xsbug-log bash -c \"XSBUG_PORT=5004 XSBUG_HOST=localhost serial2xsbug /dev/ttyUSB0 460800 8N1\"
# xsbug-log listening on port 5002. ^C to exit.
# Connected to "main"
Skipping Ethernet setup because Wi-Fi SSID is configured.
Wi-Fi connected to "xxxx"
IP address xxxxxxxx
<info>{"payload":1678738507069,"_msgid":"00e8dcaaabb53f82","source":{"id":"b0ce969590fa53d8","type":"debug","name":"debug 23"}}
mqttClient error: unknown
<info>{"payload":1678738512069,"_msgid":"4bbaac55d8904805","source":{"id":"b0ce969590fa53d8","type":"debug","name":"debug 23"}}
<info>{"payload":1678738517069,"_msgid":"0c75047ddcec5b31","source":{"id":"b0ce969590fa53d8","type":"debug","name":"debug 23"}}
mqttClient error: unknown

So far so good. The only thing I don't understand is that I didn't receive any errors on my Catch node output about this. Normally I very rarely use the Catch node, but in this case I had hoped/expected that it could give me enough information without having to relay on xsbug and a serial connection...

If anybody sees a problem in my way of thinking, please share!

Problem 2: flow keeps hanging

Now I entered the correct MQTT broker settings in my MQTT-Out node. But then I get this:

>> IDF_PYTHON_ENV_PATH: /home/pi/.espressif/python_env/idf4.4_py3.9_env
>> mcconfig -d -x localhost:5004 -l -v -m -p esp32/wt32_eth01 -t xsbug ssid=xxx password=yyy
/home/pi/esp-idf/tools/idf.py
# starting xsbug
PORT_USED=$(grep 'Serial port' /home/pi/Projects/moddable/build/tmp/esp32/wt32_eth01/debug/t5rg16s07b/xsProj-esp32/flashOutput | awk 'END{print($3)}'); \
cd /home/pi/Projects/moddable/tools/xsbug-log && node xsbug-log bash -c \"XSBUG_PORT=5004 XSBUG_HOST=localhost serial2xsbug /dev/ttyUSB0 460800 8N1\"
# xsbug-log listening on port 5002. ^C to exit.
# Connected to "main"
Skipping Ethernet setup because Wi-Fi SSID is configured.
Wi-Fi connected to "xxx"
IP address xxxxxxx
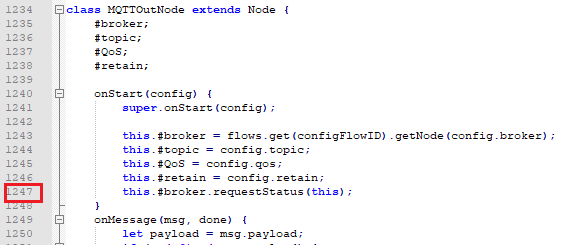
# Break: MQTTOutNode.prototype.onStart: cannot coerce undefined to object!
  #0: MQTTOutNode.prototype.onStart /home/pi/.node-red/node_modules/@ralphwetzel/node-red-mcu-plugin/node-red-mcu/nodered.js:1247
  #1: build /home/pi/Projects/moddable/build/tmp/esp32/wt32_eth01/debug/t5rg16s07b/modules/flows.js:59
  #2: RED.build /home/pi/.node-red/node_modules/@ralphwetzel/node-red-mcu-plugin/node-red-mcu/nodered.js:163
  #3: main /home/pi/.node-red/mcu-plugin-cache/t5rg16s07b/main.js:3
  #4: (host)
  #5: @anonymous-2193
  #6: (anonymous-649) /home/pi/.node-red/node_modules/@ralphwetzel/node-red-mcu-plugin/node-red-mcu/setupwifi.js:47
  #7: (anonymous-812) /home/pi/Projects/moddable/examples/network/wifi/wificonnection/wificonnection.js:95
  #8: (host)
XS abort: unhandled exception
# Break: C: xsDebugger!
  #0: (host)
  #1: @anonymous-2193
  #2: (anonymous-649) /home/pi/.node-red/node_modules/@ralphwetzel/node-red-mcu-plugin/node-red-mcu/setupwifi.js:47
  #3: (anonymous-812) /home/pi/Projects/moddable/examples/network/wifi/wificonnection/wificonnection.js:95
  #4: (host)
# Disconnected from "main"

And the notifications keep popping up in my flow editor:

ralph

Since it has an "undefined" at nodered.js at line 1247, I assume the #broker is undefined:

image

Which means (line 1243) it cannot find my config node, although it is available in my flow editor:

image

I assume I need to register a issue in the Github repo of node-red-mcu?

But do you have any idea why the notifications keep popping up. Is this perhaps a timer that polls the status every x time?

This seems the wrong way around ?

Why would you want to use wifi if Ethernet was attached ?

Hi @smcgann99,
Yes absolutely correct. You don't buy a (more expensive) wt32-eth01 device to use it with wifi. In my case it will be installed afterwards with a long cat cable in my garden. But now it is simply connected with a TTL-USB converter to my Raspberry, to experiment with node-red-mcu. Once it is running, I will turn of its wifi...

Is the error caught by the catch node in legacy NR?

Could you please post the flows.json from the working directory (its location should be logged by the plugin) for verification. The MQTT nodes tend to be very stable meanwhile - and such a severe issue should have been popped up before.

Sure: The MCU is in an endless cycle of start - run - crash - restart - run - crash - restart - ... & reporting it's state back to the editor.

Ah nice spotted, how stupid of me.
Indeed if I use the Catch and the MQTT-Out node in standard Node-RED, it indeed also doesn't output messages when the MQTT broker cannot be reached.

So the rule of thumb for the Catch node in node-red-mcu is:you can only catch exceptions that can be catched in non-mcu mode...

So forget about that.

Thanks to your tip of the flows.json file, I got a clue about what is going wrong. I have created a Github issue for this. Thanks!!