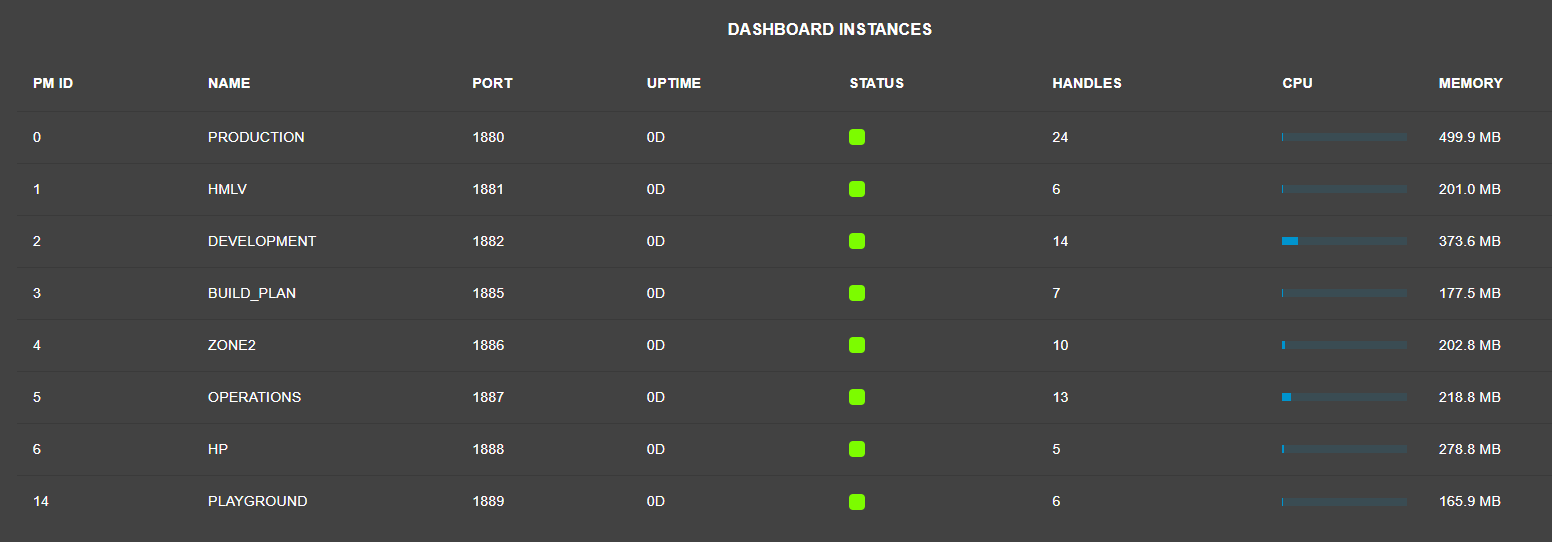
For those of you using pm2 to launch and monitor your instances, this flow lets you monitor from within Node-Red
Update 04-Jul-2025
Just realised that port info is not available via the pm2 command. In my case I had set up my dashboard directory names with the port number and so was able to retrieve this from the pm2 jlist output
I've updated the flow to retrieve the port numbers from the pids of the node-red instances
So for example
ss -lptn | grep pid=357260
LISTEN 0 511 0.0.0.0:1889 0.0.0.0:* users:(("node-red",pid=357260,fd=19))
[{"id":"bfa40032e7b236f5","type":"group","z":"d63da7d39b03706f","name":"Node-Red","style":{"fill":"#7fb7df","label":true,"color":"#000000"},"nodes":["5c732e4feb3baed0","a08d268203b4a005","96c575b95962a468","a30fcfc64ebdd450","18220c4ca4e6f003","6d2ef10283fecb0f","63f97a4ad7c4c9e8","8fec360a293987af"],"x":34,"y":739,"w":952,"h":149.5},{"id":"5c732e4feb3baed0","type":"exec","z":"d63da7d39b03706f","g":"bfa40032e7b236f5","command":"/usr/local/bin/pm2 jlist","addpay":"","append":"","useSpawn":"false","timer":"","winHide":false,"oldrc":false,"name":"Node Info","x":200,"y":800,"wires":[["a30fcfc64ebdd450"],[],[]]},{"id":"a08d268203b4a005","type":"inject","z":"d63da7d39b03706f","g":"bfa40032e7b236f5","name":"","props":[{"p":"topic","vt":"str"}],"repeat":"300","crontab":"","once":false,"onceDelay":0.1,"topic":"OS Info","x":95,"y":800,"wires":[["5c732e4feb3baed0"]],"l":false},{"id":"96c575b95962a468","type":"function","z":"d63da7d39b03706f","g":"bfa40032e7b236f5","name":"Map","func":"const dashboards=msg.payload\nlet props = [];\nconst numberPattern = /\\d{4}/g\n//payload[1].pm2_env.args[1]\n\ndashboards.forEach(dashboard => {\n const d1 = new Date(dashboard.pm2_env.pm_uptime)\n const d2 = new Date();\n const diff = Math.abs(d2.getTime() - d1.getTime())\n const updays = Math.floor(diff / (1000 * 60 * 60 * 24))\n const name = dashboard.name.toUpperCase()\n //const pid = dashboard.pm2_env.args[1]\n //node.warn(path)\n //const port =path.match(numberPattern)[0]\n const mem = (dashboard.monit.memory/ (1024 * 1024)).toFixed(1) + \" MB\"\n const status = dashboard.pm2_env.status=='online' ?'lawngreen':'orange'\n const handles =dashboard.pm2_env.axm_monitor[\"Active handles\"]\n const requests =dashboard.pm2_env.axm_monitor[\"Active requests\"]\n\n\n let arr = { \n \"PMID\": dashboard.pm_id ,\n \"NAME\": name,\n \"PORT\": \"\",\n \"PID\": dashboard.pid,\n \"UPTIME\": updays+'D',\n \"STATUS\": status,\n \"CPU\": dashboard.monit.cpu +'%',\n \"HANDLES\": handles.value,\n \"REQUESTS\": requests.value,\n \"MEMORY\": mem,\n };\n props.push(arr);\n})\n\nmsg.payload=props\nreturn msg;","outputs":1,"timeout":0,"noerr":0,"initialize":"","finalize":"","libs":[],"x":510,"y":780,"wires":[["6d2ef10283fecb0f"]]},{"id":"a30fcfc64ebdd450","type":"json","z":"d63da7d39b03706f","g":"bfa40032e7b236f5","name":"","property":"payload","action":"","pretty":false,"x":370,"y":780,"wires":[["96c575b95962a468"]]},{"id":"18220c4ca4e6f003","type":"ui-table","z":"d63da7d39b03706f","g":"bfa40032e7b236f5","group":"1c54b30d7d8e7c7b","name":"Node-RED","label":"DASHBOARD INSTANCES","order":3,"width":0,"height":0,"maxrows":0,"passthru":false,"autocols":false,"showSearch":false,"deselect":true,"selectionType":"click","columns":[{"title":"PM ID","key":"PMID","keyType":"key","type":"text","width":"","align":"start"},{"title":"NAME","key":"NAME","keyType":"key","type":"text","width":"","align":"start"},{"title":"PORT","key":"PORT","keyType":"key","type":"text","width":"","align":"start"},{"title":"UPTIME","key":"UPTIME","keyType":"key","type":"text","width":"","align":"start"},{"title":"STATUS","key":"STATUS","keyType":"key","type":"color","width":"","align":"start"},{"title":"HANDLES","key":"HANDLES","keyType":"key","type":"text","width":"","align":"start"},{"title":"CPU","key":"CPU","keyType":"key","type":"progress","width":"","align":"start"},{"title":"MEMORY","key":"MEMORY","keyType":"key","type":"text","width":"","align":"start"}],"mobileBreakpoint":"sm","mobileBreakpointType":"defaults","action":"replace","x":890,"y":840,"wires":[[]]},{"id":"6d2ef10283fecb0f","type":"function","z":"d63da7d39b03706f","g":"bfa40032e7b236f5","name":"cmd","func":"const instances=msg.payload\nmsg.instances=instances\nlet cmd=''\ninstances.forEach(instance => {\n cmd += `ss -lptn | grep pid=${instance.PID} && `\n \n});\n\nmsg.payload=cmd.slice(0,-3)\nreturn msg;\n","outputs":1,"timeout":0,"noerr":0,"initialize":"","finalize":"","libs":[],"x":430,"y":840,"wires":[["63f97a4ad7c4c9e8"]]},{"id":"63f97a4ad7c4c9e8","type":"exec","z":"d63da7d39b03706f","g":"bfa40032e7b236f5","command":"","addpay":"payload","append":"","useSpawn":"false","timer":"","winHide":false,"oldrc":false,"name":"Get Port","x":580,"y":840,"wires":[["8fec360a293987af"],[],[]]},{"id":"8fec360a293987af","type":"function","z":"d63da7d39b03706f","g":"bfa40032e7b236f5","name":"Port","func":"const ports = msg.payload.split('\\n')\nlet instances =msg.instances\nmsg.instances= null\nlet i=0\n\nports.forEach(p => {\n if(p !=\"\"){\n const port = p.substr(54, 4)\n instances[i].PORT = port\n i++\n }\n \n});\nmsg.payload=instances\nreturn msg;","outputs":1,"timeout":0,"noerr":0,"initialize":"","finalize":"","libs":[],"x":750,"y":840,"wires":[["18220c4ca4e6f003"]]},{"id":"1c54b30d7d8e7c7b","type":"ui-group","name":"Dashboard","page":"40b1bea1d5488e9d","width":"12","height":1,"order":4,"showTitle":false,"className":"","visible":"true","disabled":"false","groupType":"default"},{"id":"40b1bea1d5488e9d","type":"ui-page","name":"System Status","ui":"4740393b964cb7af","path":"/system","icon":"mdi-cog","layout":"tabs","theme":"11edfaf96d0baec1","breakpoints":[{"name":"Default","px":"0","cols":"3"},{"name":"Tablet","px":"576","cols":"6"},{"name":"Small Desktop","px":"768","cols":"9"},{"name":"Desktop","px":"1024","cols":"12"}],"order":16,"className":"","visible":"true","disabled":"false"},{"id":"4740393b964cb7af","type":"ui-base","name":"Tiger","path":"/dashboard","appIcon":"","includeClientData":true,"acceptsClientConfig":["ui-notification","ui-control","ui-dropdown","ui-chart","ui-gauge","ui-button","ui-template","ui-text","ui-table","ui-form"],"showPathInSidebar":false,"headerContent":"page","navigationStyle":"fixed","titleBarStyle":"hidden","showReconnectNotification":true,"notificationDisplayTime":"1","showDisconnectNotification":true},{"id":"11edfaf96d0baec1","type":"ui-theme","name":"Dark1","colors":{"surface":"#424242","primary":"#0094ce","bgPage":"#424242","groupBg":"#424242","groupOutline":"#424242"},"sizes":{"density":"default","pagePadding":"2px","groupGap":"6px","groupBorderRadius":"4px","widgetGap":"10px"}}]
Page