Power usage "graphs" from Tasmota device

I've got a Tasmota device that spits out messages with power usage.
(yeah, I'm anal.) :wink:

This is what I'm getting as an example.
Sorry there is no actual values.

{"Time":"2024-02-06T07:10:47",
"ENERGY":{"TotalStartTime":"2024-02-02T06:22:14",
"Total":0,
"Yesterday":0,
"Today":0,
"Period":0,
"Power":0,
"ApparentPower":0,
"ReactivePower":0,
"Factor":0,
"Voltage":241,
"Current":0}}

And yes, if I don't know what I want: what's the point in me asking.....

I'm just starting and am feeling what is available.

Yes, a chart is/would be the obvious choice. But....

To me it takes up too much real estate on the screen for what it gives./shows me.

A multi-needle gauge would be good here IMO.

Today's power on one,
Yesterday's on another one.
The Power value on another

So that's 3.

I get it that the first 2 would be on a different scale than the third.
Hey: nothing is perfect. :wink:

Would something like that be possible?
A Multi pointer gauge?

Andrew, if you want to track power usage, then a chart is the best option. A gauge will only show momentary values.

Yeah, I do understand that.

At this stage, I am only interested in looking at the there and then values.

As said: screen real estate is kind of limited.

I have a PZEM-004T that sends readings via MQTT to Node-RED.
PZEM

My dashboard shows instantaneous readings on the gauges and a graph of the last 3-hrs power usage.

Here's part of my Node-RED flow.


A well as directing the readings to the dashboard, I also log them on a local MySQL dB and send them to Clarify so I can inspect them with their interactive graphing tools and viewer.

1 Like

Looks good.

But (sorry) I am wanting to try and optimise the gauges.

Alas yours are very different ranges so can't be combined as is.

But say you multiplied the current by 100, then you would have two with similar ranges

Then you put them both on one gauge showing their values.
Kind of like a speedometer is on a car.
Or, hands on a clock.

But then you halve the screen space needed/used.

Again: screen real estate is kinda limited.

But I'll keep it in mind.

All this is new to me and I haven't yet got a full picture of what/how I want to display it.
But couldn't really think about this until I got a working set of readings.

(Catch 22)

I know there are other graph ones like the LED STRIP one and a couple of other gauges but they don't allow/have/give you the option of merging two indicators into one range.

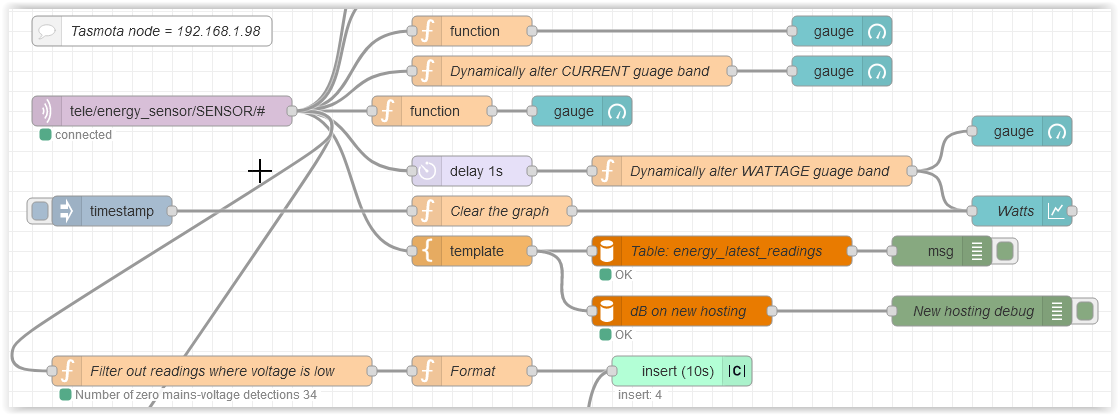
Note: In my flow I've 'engineered' the current and wattage gauges to have dynamic ranges.
Here's part of one of the function nodes that changes the 'min' 'max' values on a guage.

var current = flow.get("current") || 1.0;
var power = voltage * current;
power = power.toFixed(0);

if (power > 10000) {
    max = 20000;
    min = 10000;
}
else if (power > 9000) {
    max = 10000;
    min = 9000;
}
else if (power > 8000) {
    max = 9000;
    min = 8000;
}
else if (power > 7000) {
    max = 8000;
    min = 7000;
1 Like

Yes, that is a nice trick and handy to know.

But again I ask:

Is there a way (trick?) so on a gauge I can have 2 (or more) needles (different colours) indicating different things?

Like a line chart where you have a key below showing what colour represents what for each needle.
But it is strictly a here and now measurement.

I don't think that the basic gauge widget lets you have two needles.

Probably need to consider a template mode containing a more sophisticated gauge, such as some of the September Giveaway series.

1 Like

Are you sure that it's power that you want to monitor, and not energy?

Probably.

I need to do a bit of research on that.

Thanks.

Yikes, seems I will have to really study that.

I hear that multi pointer gauges are mentioned - which is good.

But quickly going through the video it kinda frightens me with all the CSS/HTML stuff.
Ok, they are hidden behind the scenes and not really of importance if I try to stratify how I look at it.

But thanks again.

Well, again I am keeping the question general more than specific as it is more a test case here.

As said, it is all new and I am wanting a compact thing to display stuff and a multi-needle gauge would/may/could be what I needed.

I think specific would be preferable :grin:

Yeah, well, just now my vocabulary() is not working as well as I would like.

So who knows if i am even asking the right question. :wink:

This topic was automatically closed 30 days after the last reply. New replies are no longer allowed.