This widget is designed for gradually changing data only. During rapid data changes, both the needle and rounded elements malfunction and create visual stuttering. The underlying issue is the non-adjustable animation delay in these components.
Are you using the old node-red-dashboard or the newer @flowfuse/node-red-dashboard, also known as Dashboard 2?
@ChrisChee Hi Chris, welcome to the forum.
I've moved your post to it's own topic, as the previous one was over a year old, and your issue is more specific.
I am using the latest version of Dashboard 2 (@ flowfuse/node red dashboard),
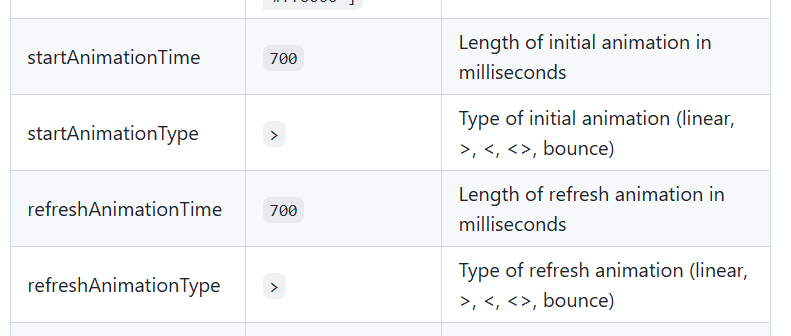
the old version does not have this issue because it does not have animation delay and animation duration
It may be possible with some clever CSS. I have had a look at it but don't have the skills necessary to work out how to do it. I can't immediately see where the transition time is set.
I do know how to adjust the transition time for node-red-dashboard-2-ui-gauge-classic.
I had a similar problem when using the DB2 chart node, in that the chart line width/style could not be changed, and which therefore did not display higher density data very well.
I worked around that by using the chart.js library in a ui-template node, where I could control the line width to whatever I wanted.
Maybe you could do something similar with a gauge node?
I've since moved to UIbuilder and use justgage, where all options are exposed, and can be tweaked;
Perfectly reasonable for us to add this in as a configuration option. Can you open a Feature Request/Issue here please: GitHub · Where software is built and I'll see if we can squeeze it in.