Hi all,
I successfully integrated Plotly charts into my Dashboard 2.0 using ui-template. But I'm having problem sizing ui-template inside the dashboard group. If I set the ui-template size as auto in node properties, the chart is displayed as compressed in height.


If I set the size to 12x6, I am able to see the chart correctly.
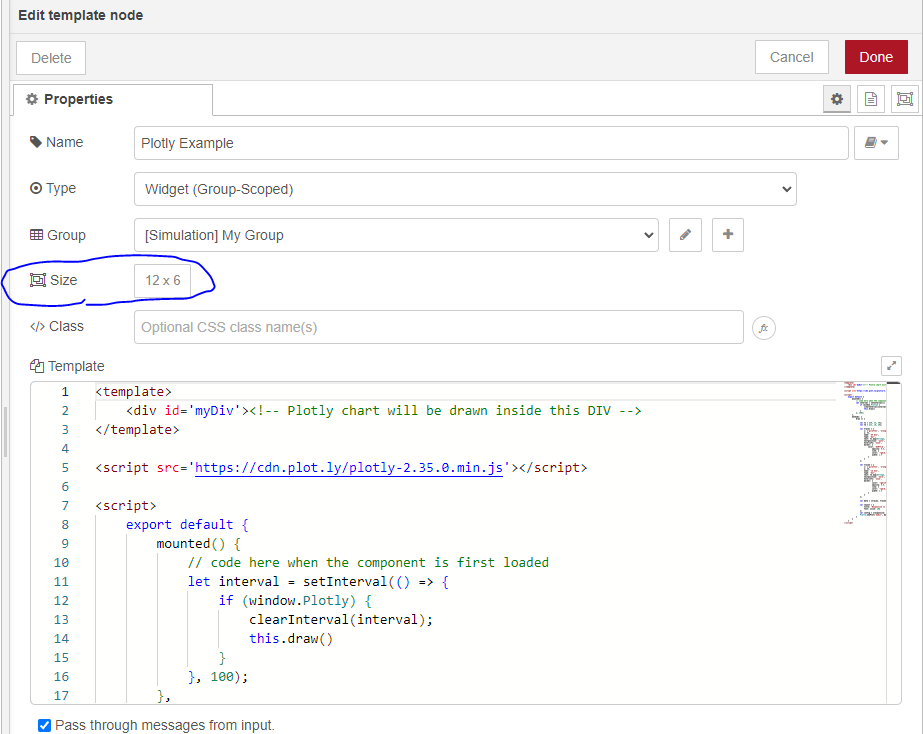

The size of group containing ui-template is set to 12x6.

Why does this happen? How can I make the ui-template size expanded to the size of the group?
Thanks in advance.
Below is my flow for the ui-template
[
    {
        "id": "d6682ace35ba3d31",
        "type": "ui-template",
        "z": "415d536515768e0b",
        "group": "0db8d9f5bdc794eb",
        "page": "",
        "ui": "",
        "name": "Plotly Example",
        "order": 2,
        "width": "12",
        "height": "6",
        "head": "",
        "format": "<template>\n    <div id='myDiv'><!-- Plotly chart will be drawn inside this DIV -->\n</template>\n\n<script src='https://cdn.plot.ly/plotly-2.35.0.min.js'></script>\n\n<script>\n    export default {\n        mounted() {\n            // code here when the component is first loaded\n            let interval = setInterval(() => {\n                if (window.Plotly) {\n                    clearInterval(interval);\n                    this.draw()\n                }\n            }, 100);\n        },\n        methods: {\n            draw () {\n                \n                var t1 = [20, 14, 39];\n                var t2 = [12, 18, 29];\n\n                var trace1 = {\n                    x: ['giraffes', 'orangutans', 'monkeys'],\n                    y: t1,\n                    name: 'SF Zoo',\n                    type: 'bar',\n                    text: t1.map(String),\n                    textposition: 'auto',\n                    hoverinfo: 'none',\n                    marker: {\n                        color: '#207fcd',\n                            opacity: 0.6,\n                            line: {\n                            color: 'rgb(8,48,107)',\n                            width: 1.5\n                        }\n                    }\n                };\n\n                var trace2 = {\n                    x: ['giraffes', 'orangutans', 'monkeys'],\n                    y: t2,\n                    name: 'LA Zoo',\n                    type: 'bar',\n                    text: t2.map(String),\n                    textposition: 'auto',\n                    hoverinfo: 'none',\n                    marker: {\n                            color: 'rgb(158,202,225)',\n                            opacity: 0.6,\n                            line: {\n                            color: 'rgb(8,48,107)',\n                            width: 1.5\n                        }\n                    }\n                };\n\n                var data = [trace1, trace2];\n\n                var layout = { \n                    title: 'Responsive to window\\'s size!',\n                    font: {size: 18}\n                };\n                var config = {responsive: true}\n                Plotly.newPlot('myDiv', data, layout, config );\n            }\n        }\n    }\n</script>",
        "storeOutMessages": true,
        "passthru": true,
        "resendOnRefresh": true,
        "templateScope": "local",
        "className": "",
        "x": 440,
        "y": 1380,
        "wires": [
            []
        ]
    },
    {
        "id": "0db8d9f5bdc794eb",
        "type": "ui-group",
        "name": "My Group",
        "page": "92d2e5483adf6001",
        "width": "12",
        "height": "6",
        "order": 1,
        "showTitle": true,
        "className": "",
        "visible": "true",
        "disabled": "false"
    },
    {
        "id": "92d2e5483adf6001",
        "type": "ui-page",
        "name": "Simulation",
        "ui": "caf9593480b4ab3b",
        "path": "/page1",
        "icon": "home",
        "layout": "grid",
        "theme": "d8f055e104cc1454",
        "order": 1,
        "className": "",
        "visible": "false",
        "disabled": "false"
    },
    {
        "id": "caf9593480b4ab3b",
        "type": "ui-base",
        "name": "My Dashboard",
        "path": "/dashboard",
        "includeClientData": true,
        "acceptsClientConfig": [],
        "showPathInSidebar": false,
        "showPageTitle": true,
        "navigationStyle": "default",
        "titleBarStyle": "default"
    },
    {
        "id": "d8f055e104cc1454",
        "type": "ui-theme",
        "name": "Default Theme",
        "colors": {
            "surface": "#ffffff",
            "primary": "#0094CE",
            "bgPage": "#eeeeee",
            "groupBg": "#ffffff",
            "groupOutline": "#cccccc"
        },
        "sizes": {
            "pagePadding": "12px",
            "groupGap": "12px",
            "groupBorderRadius": "4px",
            "widgetGap": "12px"
        }
    }
]