Hi everyone,
I’d like to render a 4-axis radar (spider) chart in the Dashboard. I know there’s no native widget for this, so I’m wondering if anyone has implemented it via ui_template.
- Goal: 4 axes (4 metrics), real-time updates from
msg.payload. - Constraint: preferably stay within Dashboard (not necessarily uibuilder), but I’m open to any solution.
- Nice to have: styling examples (colors, filled area, min/max), and responsive behavior.
If you have any pointers, examples, flows, or projects
showing a radar chart via ui_template (Chart.js, ECharts, etc.), I’d really appreciate it.
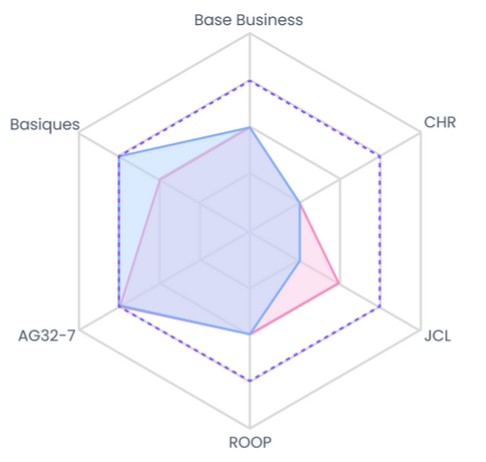
I’ll attach a sample image of the look I’m aiming for.
Thanks!