Can someone try this flow to see if the following plot is generated without the straight line

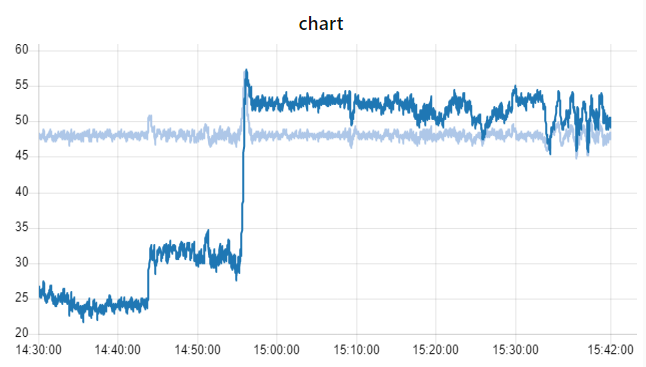
Here I am trying to trend two data vectors in a time series but it doesn't work in my node-red dashboard. I have communicated with someone who said otherwise. Can someone try it to see if the following plot is different:

[{"id":"2874c9cd.0b97d6","type":"inject","z":"15b37612.f7127a","name":"","topic":"start","payload":"1","payloadType":"str","repeat":"","crontab":"","once":false,"onceDelay":"0.5","x":590,"y":120,"wires":[["59c94d12.805294"]]},{"id":"4121e2e5.4e805c","type":"debug","z":"15b37612.f7127a","name":"","active":true,"tosidebar":true,"console":false,"tostatus":false,"complete":"true","targetType":"full","x":1070,"y":60,"wires":[]},{"id":"7a18d027.21869","type":"csv","z":"15b37612.f7127a","name":"","sep":",","hdrin":true,"hdrout":"","multi":"mult","ret":"\\n","temp":"","skip":"0","strings":true,"x":770,"y":120,"wires":[["d096bbd7.8e9268"]]},{"id":"d096bbd7.8e9268","type":"function","z":"15b37612.f7127a","name":"split data","func":"var payload=msg.payload;\nvar a=[\"\"];\nfor(i=0;i<payload.length;i++)\n{\n\nif (payload[i].col1==\"u\" || payload[i].col1==\"y\")\na.push(payload[i]);\n\n}\nmsg.payload=a;\nreturn msg;","outputs":1,"noerr":0,"x":920,"y":120,"wires":[["98915264.a6487"]]},{"id":"98915264.a6487","type":"function","z":"15b37612.f7127a","name":"graph generate","func":"function toTimestamp(strDate){\n     var datum = Date.parse(strDate);\n     return datum/1000;\n    }\nvar payload=msg.payload;\n//var t =toTimestamp('02/13/2009 23:31:30')\n\nvar Data= \"2020-08-8\".split(\"-\");\nData=Data[2]+\"/\"+Data[1]+\"/\"+Data[0];\nnode.log(Data);\nt =toTimestamp(Data+\" 14:30:00\");\nvar data_out=[];\nvar a1=[];\nvar a2=[];\nfor(let i=0;i<payload.length;i++)\n{\n  \n\nif(payload[i].col1==\"u\")\n{\nvar timestamp=toTimestamp(t+\" \"+payload[i]);\nvar temp1={ \"x\": (payload[i].col2).replace(/ /g,''), \"y\":Number( payload[i].col3) };\na1.push(temp1);\n}\nif(payload[i].col1==\"y\")\n{\nvar timestamp=toTimestamp(t+\" \"+payload[i]);\nvar temp2={ \"x\": (payload[i].col2).replace(/ /g,''), \"y\":Number( payload[i].col3) };\na2.push(temp2);\n}\n\n}\n\ndata_out=[a1,a2];\nmsg.payload=[{\n\"series\": [\"outlet flow from vessel\",\"level % in vessel\",],\n\"data\":data_out,\n\"labels\": [\"\"]\n}];\nmsg.t=t;\nreturn msg;","outputs":1,"noerr":0,"x":1100,"y":120,"wires":[["4121e2e5.4e805c","3cf01acc.f49b66"]]},{"id":"59c94d12.805294","type":"file in","z":"15b37612.f7127a","name":"","filename":"C:\\IMPL\\SISOARXRegression\\sisoarxdata.csv","format":"utf8","chunk":false,"sendError":false,"encoding":"none","x":700,"y":60,"wires":[["7a18d027.21869"]]},{"id":"3cf01acc.f49b66","type":"ui_chart","z":"15b37612.f7127a","name":"","group":"5c626731.4aa6d8","order":0,"width":0,"height":0,"label":"chart","chartType":"line","legend":"false","xformat":"HH:mm:ss","interpolate":"linear","nodata":"","dot":false,"ymin":"","ymax":"","removeOlder":1,"removeOlderPoints":"","removeOlderUnit":"3600","cutout":0,"useOneColor":false,"colors":["#1f77b4","#aec7e8","#ff7f0e","#2ca02c","#98df8a","#d62728","#ff9896","#9467bd","#c5b0d5"],"useOldStyle":false,"outputs":1,"x":1270,"y":120,"wires":[[]]},{"id":"5c626731.4aa6d8","type":"ui_group","z":"","name":"Digital PI Controllers","tab":"582ef43c.0a8acc","order":1,"disp":true,"width":"20","collapse":false},{"id":"582ef43c.0a8acc","type":"ui_tab","z":"","name":"Tuning Digital PI Controllers","icon":"dashboard","order":5,"disabled":false,"hidden":false}]type or paste code here

You can see from the timestamps along the bottom that there is something wrong with the timestamps you are injecting. Show use what the data you are sending it looks like in a debug node. In particular look at the timestamps.

Here I have x being the vector of 4320 data point that is replaced t as it is used in the function node t =toTimestamp(Data+" 14:30:00"); also the return msg is msg.t=t; return msg;

All I can do is repeat exactly the answer I gave the last time you asked about this, at which time you marked this answer as the solution.

Colin,

I try to attach the csv file but it says "the file is too big (maximum size is 4096KB)."

I understand that you pointed where the issue is. As I explained above there was a communication with someone whose able of running the file with `

if(payload[i].col1=="u")
{
var temp1={ "x": (payload[i].col2).replace(/ /g,''), "y":Number( payload[i].col3) };
a1.push(temp1);
}
if(payload[i].col1=="y")
{
var temp2={ "x": (payload[i].col2).replace(/ /g,''), "y":Number( payload[i].col3) };
a2.push(temp2);
}

and that generates the following graph
image

When I run the flow I get the first plot generated above.

I marked it as a solution because it highlights the issue.

Thank you.

Just post a few lines of the file. Paste it in using the </> button at the top of the forum entry window.

[Edit] The flow you posted earlier is not importable, it stops in the middle. Try that again.

Sorry, but I had an internet issue.

!@rProfit_Value	@rPerformance1_Value	@rPerformance2_Value	@rPenalty_Value	@rTotal_Value
!   0.0000000000E+000	0.00E+00	0.00E+00	0.00E+00	0.00E+00
!@rProfit_Value	@rPerformance1_Value	@rPerformance2_Value	@rPenalty_Value	@rTotal_Value
 				
				
!sisoarxdatau.csv				
!u				
!sisoarxdatay.csv				
!y				
!sisoarxdataw1.csv				
!w1				
!sisoarxdataw2.csv				
!w2				
!sisoarxdataw3.csv				
!w3				
!sisoarxdataw4.csv				
!w4				
!sisoarxdataw5.csv				
!w5				
				
				
arx1	1	-8.57E-01		
arx1	2	0.00E+00		
arx1	3	0.00E+00		
arx1	4	1.00E+00		
arx1	5	-1.00E+05		
				
arx2	1	2.22E-01		
arx2	2	0.00E+00		
arx2	3	0.00E+00		
arx2	4	2.00E+00		
arx2	5	-1.00E+05		
				
arx3	1	3.17E-02		
arx3	2	0.00E+00		
arx3	3	0.00E+00		
arx3	4	3.00E+00		
arx3	5	-1.00E+05		
				
arx4	1	-5.82E-02		
arx4	2	0.00E+00		
arx4	3	0.00E+00		
arx4	4	4.00E+00		
arx4	5	-1.00E+05		
				
arx5	1	-1.04E-02		
arx5	2	0.00E+00		
arx5	3	0.00E+00		
arx5	4	5.00E+00		
arx5	5	-1.00E+05		
				
u	1	2.60E+01		
u	2	2.59E+01		
u	3	2.58E+01		
u	4	2.66E+01		
u	5	2.61E+01		
u	6	2.55E+01		
u	7	2.57E+01		
u	8	2.58E+01		
u	9	2.62E+01		
u	10	2.59E+01		
u	11	2.53E+01		
u	12	2.58E+01		
u	13	2.62E+01		
u	14	2.54E+01		
u	15	2.59E+01		
u	16	2.56E+01		
u	17	2.54E+01		
u	18	2.52E+01		
u	19	2.59E+01		
u	20	2.60E+01		
				
y	1	4.79E+01		
y	2	4.79E+01		
y	3	4.78E+01		
y	4	4.83E+01		
y	5	4.80E+01		
y	6	4.76E+01		
y	7	4.78E+01		
y	8	4.78E+01		
y	9	4.81E+01		
y	10	4.80E+01		
y	11	4.76E+01		
y	12	4.79E+01		
y	13	4.81E+01		
y	14	4.76E+01		
y	15	4.80E+01		
y	16	4.78E+01		
y	17	4.77E+01		
y	18	4.75E+01		
y	19	4.80E+01		
y	20	4.80E+01

Can you explain what that means? I don't see the timestamps in there.

(And.... please use the </> button as requested)

You did ask me to post a few lines of the file. This is how the csv file looks like.

I am trying to plot u and y value with the 20 points (x) index being the timestamp

Here t is the timestamp

You say the u values are a timestamp, but they are just integer values 1, 2, 3 so what times do those values represent? Assuming, that is, that they do represent timestamps, which is a question I did ask previously, on the other thread, but you never replied as far as I know.

Colin - as I understand it they want to plot both y and u values (as different topics) against the index in the array as a virtual timestamp. (ie number from 0 to 20). Nothing wrong with that - would be sensible to re-label the x axis format to be X to just show it as the epoch value to match.

1 Like

The split on csv node seems to work best on Tab then all values are returned as number.
The functions has some sort of date, so figure this data wants to set with this date and each reading is a second apart. Just reading between the lines. Correct me if i am wrong.
Try someting like this

[{"id":"12d42c43.79cc5c","type":"inject","z":"8d22ae29.7df6d","name":"","props":[{"p":"payload"},{"p":"topic","vt":"str"}],"repeat":"","crontab":"","once":false,"onceDelay":0.1,"topic":"","payload":"","payloadType":"date","x":130,"y":2420,"wires":[["ea17cb4a.a90308"]]},{"id":"ea17cb4a.a90308","type":"template","z":"8d22ae29.7df6d","name":"","field":"payload","fieldType":"msg","format":"handlebars","syntax":"mustache","template":"!@rProfit_Value\t@rPerformance1_Value\t@rPerformance2_Value\t@rPenalty_Value\t@rTotal_Value\n!   0.0000000000E+000\t0.00E+00\t0.00E+00\t0.00E+00\t0.00E+00\n!@rProfit_Value\t@rPerformance1_Value\t@rPerformance2_Value\t@rPenalty_Value\t@rTotal_Value\n \t\t\t\t\n\t\t\t\t\n!sisoarxdatau.csv\t\t\t\t\n!u\t\t\t\t\n!sisoarxdatay.csv\t\t\t\t\n!y\t\t\t\t\n!sisoarxdataw1.csv\t\t\t\t\n!w1\t\t\t\t\n!sisoarxdataw2.csv\t\t\t\t\n!w2\t\t\t\t\n!sisoarxdataw3.csv\t\t\t\t\n!w3\t\t\t\t\n!sisoarxdataw4.csv\t\t\t\t\n!w4\t\t\t\t\n!sisoarxdataw5.csv\t\t\t\t\n!w5\t\t\t\t\n\t\t\t\t\n\t\t\t\t\narx1\t1\t-8.57E-01\t\t\narx1\t2\t0.00E+00\t\t\narx1\t3\t0.00E+00\t\t\narx1\t4\t1.00E+00\t\t\narx1\t5\t-1.00E+05\t\t\n\t\t\t\t\narx2\t1\t2.22E-01\t\t\narx2\t2\t0.00E+00\t\t\narx2\t3\t0.00E+00\t\t\narx2\t4\t2.00E+00\t\t\narx2\t5\t-1.00E+05\t\t\n\t\t\t\t\narx3\t1\t3.17E-02\t\t\narx3\t2\t0.00E+00\t\t\narx3\t3\t0.00E+00\t\t\narx3\t4\t3.00E+00\t\t\narx3\t5\t-1.00E+05\t\t\n\t\t\t\t\narx4\t1\t-5.82E-02\t\t\narx4\t2\t0.00E+00\t\t\narx4\t3\t0.00E+00\t\t\narx4\t4\t4.00E+00\t\t\narx4\t5\t-1.00E+05\t\t\n\t\t\t\t\narx5\t1\t-1.04E-02\t\t\narx5\t2\t0.00E+00\t\t\narx5\t3\t0.00E+00\t\t\narx5\t4\t5.00E+00\t\t\narx5\t5\t-1.00E+05\t\t\n\t\t\t\t\nu\t1\t2.60E+01\t\t\nu\t2\t2.59E+01\t\t\nu\t3\t2.58E+01\t\t\nu\t4\t2.66E+01\t\t\nu\t5\t2.61E+01\t\t\nu\t6\t2.55E+01\t\t\nu\t7\t2.57E+01\t\t\nu\t8\t2.58E+01\t\t\nu\t9\t2.62E+01\t\t\nu\t10\t2.59E+01\t\t\nu\t11\t2.53E+01\t\t\nu\t12\t2.58E+01\t\t\nu\t13\t2.62E+01\t\t\nu\t14\t2.54E+01\t\t\nu\t15\t2.59E+01\t\t\nu\t16\t2.56E+01\t\t\nu\t17\t2.54E+01\t\t\nu\t18\t2.52E+01\t\t\nu\t19\t2.59E+01\t\t\nu\t20\t2.60E+01\n\t\t\t\t\ny\t1\t4.79E+01\t\t\ny\t2\t4.79E+01\t\t\ny\t3\t4.78E+01\t\t\ny\t4\t4.83E+01\t\t\ny\t5\t4.80E+01\t\t\ny\t6\t4.76E+01\t\t\ny\t7\t4.78E+01\t\t\ny\t8\t4.78E+01\t\t\ny\t9\t4.81E+01\t\t\ny\t10\t4.80E+01\t\t\ny\t11\t4.76E+01\t\t\ny\t12\t4.79E+01\t\t\ny\t13\t4.81E+01\t\t\ny\t14\t4.76E+01\t\t\ny\t15\t4.80E+01\t\t\ny\t16\t4.78E+01\t\t\ny\t17\t4.77E+01\t\t\ny\t18\t4.75E+01\t\t\ny\t19\t4.80E+01\t\t\ny\t20\t4.80E+01","output":"str","x":170,"y":2460,"wires":[["e63478d3.780968"]]},{"id":"e63478d3.780968","type":"csv","z":"8d22ae29.7df6d","name":"","sep":"\\t","hdrin":"","hdrout":"none","multi":"mult","ret":"\\n","temp":"","skip":"0","strings":true,"include_empty_strings":"","include_null_values":"","x":310,"y":2440,"wires":[["804ea78.ebb4b58"]]},{"id":"804ea78.ebb4b58","type":"function","z":"8d22ae29.7df6d","name":"","func":"var payload=msg.payload;\nvar a1=[];\nvar a2=[];\nt =new Date(\"2020-12-25T14:30:00\").valueOf();\nfor(let i=0;i<payload.length;i++){\n    if (payload[i].col1==\"u\" || payload[i].col1==\"y\"){\n        if(payload[i].col1==\"u\"){\n            var temp1={ \"x\": t + (payload[i].col2)*1000, \"y\": payload[i].col3};\n            a1.push(temp1);\n        }\n        if(payload[i].col1==\"y\"){\n            var temp2={ \"x\": t + (payload[i].col2)*1000, \"y\":payload[i].col3 };\n            a2.push(temp2);\n        }\n    }\n}\nmsg.payload=[{\n\"series\": [\"outlet flow from vessel\",\"level % in vessel\",],\n\"data\":[a1,a2],\n\"labels\": [\"\"]\n}];\n\nreturn msg;","outputs":1,"noerr":0,"initialize":"","finalize":"","x":440,"y":2440,"wires":[["5e3b51e0.76c8d8","299d29e9.317e16"]]},{"id":"5e3b51e0.76c8d8","type":"debug","z":"8d22ae29.7df6d","name":"","active":true,"tosidebar":true,"console":false,"tostatus":false,"complete":"false","statusVal":"","statusType":"auto","x":610,"y":2500,"wires":[]},{"id":"299d29e9.317e16","type":"ui_chart","z":"8d22ae29.7df6d","name":"","group":"165e1e1a.e752fa","order":6,"width":0,"height":0,"label":"chart","chartType":"line","legend":"false","xformat":"HH:mm:ss","interpolate":"linear","nodata":"","dot":false,"ymin":"","ymax":"","removeOlder":1,"removeOlderPoints":"","removeOlderUnit":"3600","cutout":0,"useOneColor":false,"useUTC":false,"colors":["#1f77b4","#aec7e8","#ff7f0e","#2ca02c","#98df8a","#d62728","#ff9896","#9467bd","#c5b0d5"],"outputs":1,"x":610,"y":2440,"wires":[[]]},{"id":"165e1e1a.e752fa","type":"ui_group","z":"","name":"Default","tab":"f9b58883.fa613","order":1,"disp":true,"width":"12","collapse":false},{"id":"f9b58883.fa613","type":"ui_tab","z":"","name":"Home","icon":"dashboard","order":1,"disabled":false,"hidden":false}]

@E1cid,

The flow works fine with the template node and shows exactly the same trend I am trying to obtain when all of the data in the csv file are pasted in the template as below.
Uploading: image.png...

Why does it not read a file-in node?

No image loaded.

Not sure, what operating system are you using?
Can you zip csv and upload ? or provide link to cloud drive.
[edit]
Is "first row contains column names" checked in the csv node, if so uncheck.

Yes, it is unchecked. I have just connected the file-in node that reads the CSV file ".exe" but the plot doesn't work in the dashboard.

Here I have copied to the attached .txt file -- please try it by changing the file exetention to csv.

Thanks

new 1.txt (586.2 KB)

image

Tested and working from file node. Please unload your test flow.

I am not sure what you mean by unload my test flow but here is what it shows in the debug node


if the file extension is .txt it works if it is csv it doesn't!

typo. upload, export.

OK here it is:

[{"id":"15b37612.f7127a","type":"tab","label":"Flow X","disabled":false,"info":""},{"id":"9a2eca35.fb68e8","type":"inject","z":"15b37612.f7127a","name":"","topic":"","payload":"","payloadType":"date","repeat":"","crontab":"","once":false,"onceDelay":0.1,"x":220,"y":200,"wires":[["14bab2e3.f9dd5d"]]},{"id":"6d00746a.6f44dc","type":"csv","z":"15b37612.f7127a","name":"","sep":"\\t","hdrin":"","hdrout":true,"multi":"mult","ret":"\\n","temp":"","skip":"0","strings":true,"x":410,"y":220,"wires":[["87143854.2242a8"]]},{"id":"87143854.2242a8","type":"function","z":"15b37612.f7127a","name":"","func":"var payload=msg.payload;\nvar a1=[];\nvar a2=[];\nt =new Date(\"2020-12-25T14:30:00\").valueOf();\nfor(let i=0;i<payload.length;i++){\n    if (payload[i].col1==\"u\" || payload[i].col1==\"y\"){\n        if(payload[i].col1==\"u\"){\n            var temp1={ \"x\": t + (payload[i].col2)*1000, \"y\": payload[i].col3};\n            a1.push(temp1);\n        }\n        if(payload[i].col1==\"y\"){\n            var temp2={ \"x\": t + (payload[i].col2)*1000, \"y\":payload[i].col3 };\n            a2.push(temp2);\n        }\n    }\n}\nmsg.payload=[{\n\"series\": [\"outlet flow from vessel\",\"level % in vessel\",],\n\"data\":[a1,a2],\n\"labels\": [\"\"]\n}];\n\nreturn msg;","outputs":1,"noerr":0,"x":530,"y":220,"wires":[["3f1d73aa.d377fc","c3e824f7.fe7dd8"]]},{"id":"3f1d73aa.d377fc","type":"debug","z":"15b37612.f7127a","name":"","active":true,"tosidebar":true,"console":false,"tostatus":false,"complete":"false","x":700,"y":280,"wires":[]},{"id":"c3e824f7.fe7dd8","type":"ui_chart","z":"15b37612.f7127a","name":"","group":"c2bc59aa.c99c78","order":6,"width":0,"height":0,"label":"chart","chartType":"line","legend":"false","xformat":"HH:mm:ss","interpolate":"linear","nodata":"","dot":false,"ymin":"","ymax":"","removeOlder":1,"removeOlderPoints":"","removeOlderUnit":"3600","cutout":0,"useOneColor":false,"colors":["#1f77b4","#aec7e8","#ff7f0e","#2ca02c","#98df8a","#d62728","#ff9896","#9467bd","#c5b0d5"],"outputs":1,"x":700,"y":220,"wires":[[]]},{"id":"14bab2e3.f9dd5d","type":"file in","z":"15b37612.f7127a","name":"","filename":"C:\\IMPL\\SISOARXRegression\\sisoarxdata.txt","format":"utf8","chunk":false,"sendError":false,"encoding":"none","x":380,"y":100,"wires":[["6d00746a.6f44dc"]]},{"id":"c2bc59aa.c99c78","type":"ui_group","z":"","name":"Default","tab":"42581827.4ae608","order":1,"disp":true,"width":"12","collapse":false},{"id":"42581827.4ae608","type":"ui_tab","z":"","name":"Home","icon":"dashboard","order":1,"disabled":false,"hidden":false}]