Change color on icon

Hello everybody!
I am new to both NR and this forum, so I hope someone can give me a solution.

I am using Rpi 3 with NR 0.19.5 , Sonoff-SV with Tasmota and Mosquitto.
I have mounted 2 magnetic sensors. One Opened and one Closed. If both are "0" the port is in the middle. If both are "1": ERROR. The sensors is on GPIO 4 and 5.
I have one Button that I change 4 icons and 4 colors from a function node.
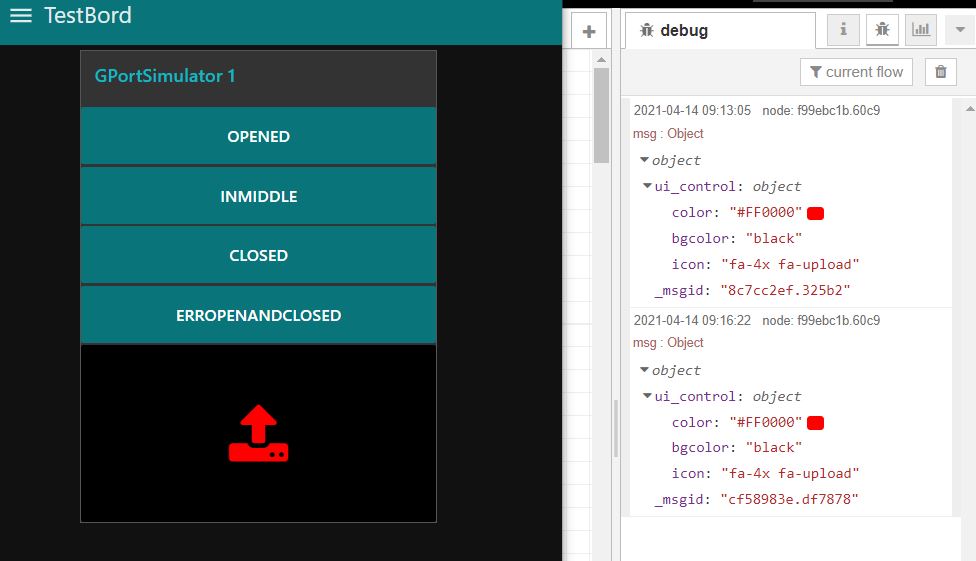
PROBLEM:
If I leave NR for say 4hours and then change the state of the sensors, only the icon change. Not the color. Now I move something in the flow (move a node), so I have to deploy. And wow, now it works again!! ??!!

Can anyone explain or/and have a solution? I have made a simulator, that have the same problem. Here is the flow:

[{"id":"63163740.2d4508","type":"tab","label":"TESTBOARD","disabled":false,"info":""},{"id":"535a18ea.47f1f8","type":"ui_button","z":"63163740.2d4508","name":"","group":"89295a31.c00768","order":5,"width":"6","height":"3","passthru":false,"label":"","color":"{{color}}","bgcolor":"{{bgcolor}}","icon":"{{icon}}","payload":"","payloadType":"str","topic":"","x":750,"y":160,"wires":[[]]},{"id":"9c7f5b9e.f3e318","type":"function","z":"63163740.2d4508","name":"FixIconColor","func":"var k = msg.payload\nif (k===0) node.send({ui_control:{color:\"#FFFF00\",bgcolor:\"black\",icon:\"fa-4x fa-spinner fa-pulse\"}});\nif (k===1) node.send({ui_control:{color:\"#00FF00\",bgcolor:\"black\",icon:\"fa-4x fa-download\"}});\nif (k===2) node.send({ui_control:{color:\"#FF0000\",bgcolor:\"black\",icon:\"fa-4x fa-upload\"}});\nif (k===3) node.send({ui_control:{color:\"#FF0000\",bgcolor:\"black\",icon:\"fa-4x fa-exclamation-triangle\"}});\n\n/*  0=moving\n    1=closed\n    2=opened\n    3=error   */\nmsg.payload = k;\nreturn [null];","outputs":1,"noerr":0,"x":470,"y":160,"wires":[["535a18ea.47f1f8"]]},{"id":"d1362218.b5d5e","type":"ui_button","z":"63163740.2d4508","name":"","group":"89295a31.c00768","order":2,"width":0,"height":0,"passthru":false,"label":"InMiddle","color":"","bgcolor":"","icon":"","payload":"0","payloadType":"num","topic":"","x":160,"y":220,"wires":[["9c7f5b9e.f3e318"]]},{"id":"2e15ddfb.c2d3e2","type":"ui_button","z":"63163740.2d4508","name":"","group":"89295a31.c00768","order":3,"width":0,"height":0,"passthru":false,"label":"Closed","color":"","bgcolor":"","icon":"","payload":"1","payloadType":"num","topic":"","x":160,"y":260,"wires":[["9c7f5b9e.f3e318"]]},{"id":"6bdd972a.905108","type":"ui_button","z":"63163740.2d4508","name":"","group":"89295a31.c00768","order":1,"width":0,"height":0,"passthru":false,"label":"Opened","color":"","bgcolor":"","icon":"","payload":"2","payloadType":"num","topic":"","x":160,"y":180,"wires":[["9c7f5b9e.f3e318"]]},{"id":"4161a979.0b0a18","type":"ui_button","z":"63163740.2d4508","name":"","group":"89295a31.c00768","order":4,"width":0,"height":0,"passthru":false,"label":"ErrOpenAndClosed","color":"","bgcolor":"","icon":"","payload":"3","payloadType":"num","topic":"","x":190,"y":140,"wires":[["9c7f5b9e.f3e318"]]},{"id":"89295a31.c00768","type":"ui_group","z":"","name":"GPortSimulator 1","tab":"1309dc77.e283d4","order":13,"disp":true,"width":"6","collapse":false},{"id":"1309dc77.e283d4","type":"ui_tab","z":"","name":"TestBord","icon":"dashboard","order":1}]

Add debug nodes so that you can see what is going on. Then when it fails work out which bit is not doing what you expect by looking at the debug output.

What do you mean by that?

No "sensors" change, nobody presses the pushbuttons for say 4 hours.

Thank you for quick answer!


A picture is worth a thousand words.
NR has been dormant since last night. I pushed "opened", that is the first picture. Then I moved the dbugnode a little bit, so I have to deploy. After that I pushed "opened" ones more, picture 2.
And I can not see any differens in dbug!

First off, you are on an old version of Node-RED (v0.19.5 - v0.19.0 was released in August of 2018).

What version of raspbian are you on? (from a termnial window enter:

cat /etc/os-release

copy and paste into a reply the results

I would suggest you:

  1. backup your SD card (don't do anything else until you have done this!)
  2. update node-red using the script: Running on Raspberry Pi : Node-RED
  3. test it again.

This will eliminate any issues that have already been fixed. Then we can go from there.

Also make sure that any extra nodes you have installed are up to date, particularly the dashboard.

I have updated NR, but how can I update dashboard nodes??
Same problem remains still.
Soory, forgot this:
PRETTY_NAME="Raspbian GNU/Linux 9 (stretch)"
NAME="Raspbian GNU/Linux"
VERSION_ID="9"
VERSION="9 (stretch)"
VERSION_CODENAME=stretch
ID=raspbian
ID_LIKE=debian
HOME_URL="http://www.raspbian.org/"
SUPPORT_URL="RaspbianForums - Raspbian"
BUG_REPORT_URL="http://www.raspbian.org/RaspbianBugs"

In the menu Manage Palette it will show nodes you have installed and give you the option of updating them. Unfortunately there is a bug in 1.3.2 of node red (that will be fixed in a new release today which means that it may not show you all the updates. If it does not say that node-red-dashboard is 2.28.2, and is not showing the Update option, then in a terminal go to your .node-red folder and run
npm install node-red-dashboard@2.28.2

So far so good! I got other problems that I have worked with (Webradio), so tomorrow I will test simulator again.
I lost my dropdown menu on left side. The new one takes half mobile screen. Is it possible to get back dropdown menu??

Can you take a screenshot showing what you are seeing now and explain what it used to be like?

I think I know what the issue is here - I had the same problem when I updated the dashboard nodes some months ago.

Basically, the ratio of space for the drop down title (on the left) vs the actual menu text / selected item (on the right) has changed.

Now if your drop down title is even 2 short words, the 2nd word gets cut off (and there is way too much space allocated for the actual menu text).

For example:

In addition, the very right corner of the drop down arrow is cut off.

The problem is still there and now the icon does not change either.
Now you see the menu (in left) instead of earlier picture, where it was dropdown menu.
I would appreciate getting the "dropdown menu" back.
Anybody, suggestions ??

Ensure it is set to click to show menu in the dashboard config site sidebar

Can you provide your flow? Export the entire flow and paste it into a reply. In order to make code more readable and importable it is important to surround your code with three backticks
```
like this
```

You can edit and correct your post by clicking the pencil icon.

See this post for more details - How to share code or flow json

dceejay as you see in the picture I have lost the dashboard choice too !!
Here is the flow:

[{"id":"63163740.2d4508","type":"tab","label":"TESTBOARD","disabled":false,"info":""},{"id":"535a18ea.47f1f8","type":"ui_button","z":"63163740.2d4508","name":"","group":"89295a31.c00768","order":5,"width":"6","height":"3","passthru":false,"label":"","color":"{{color}}","bgcolor":"{{bgcolor}}","icon":"{{icon}}","payload":"","payloadType":"str","topic":"","x":750,"y":160,"wires":[[]]},{"id":"9c7f5b9e.f3e318","type":"function","z":"63163740.2d4508","name":"FixIconColor","func":"var k = msg.payload\nif (k===0) node.send({ui_control:{color:\"#FFFF00\",bgcolor:\"black\",icon:\"fa-4x fa-spinner fa-pulse\"}});\nif (k===1) node.send({ui_control:{color:\"#00FF00\",bgcolor:\"black\",icon:\"fa-4x fa-download\"}});\nif (k===2) node.send({ui_control:{color:\"#FF0000\",bgcolor:\"black\",icon:\"fa-4x fa-upload\"}});\nif (k===3) node.send({ui_control:{color:\"#FF0000\",bgcolor:\"black\",icon:\"fa-4x fa-exclamation-triangle\"}});\n\n/*  0=moving\n    1=closed\n    2=opened\n    3=error   */\nmsg.payload = k;\nreturn [null];","outputs":1,"noerr":0,"x":470,"y":160,"wires":[["535a18ea.47f1f8","f99ebc1b.60c9"]]},{"id":"d1362218.b5d5e","type":"ui_button","z":"63163740.2d4508","name":"","group":"89295a31.c00768","order":2,"width":0,"height":0,"passthru":false,"label":"InMiddle","color":"","bgcolor":"","icon":"","payload":"0","payloadType":"num","topic":"","x":160,"y":220,"wires":[["9c7f5b9e.f3e318"]]},{"id":"2e15ddfb.c2d3e2","type":"ui_button","z":"63163740.2d4508","name":"","group":"89295a31.c00768","order":3,"width":0,"height":0,"passthru":false,"label":"Closed","color":"","bgcolor":"","icon":"","payload":"1","payloadType":"num","topic":"","x":160,"y":260,"wires":[["9c7f5b9e.f3e318"]]},{"id":"6bdd972a.905108","type":"ui_button","z":"63163740.2d4508","name":"","group":"89295a31.c00768","order":1,"width":0,"height":0,"passthru":false,"label":"Opened","color":"","bgcolor":"","icon":"","payload":"2","payloadType":"num","topic":"","x":160,"y":180,"wires":[["9c7f5b9e.f3e318"]]},{"id":"4161a979.0b0a18","type":"ui_button","z":"63163740.2d4508","name":"","group":"89295a31.c00768","order":4,"width":0,"height":0,"passthru":false,"label":"ErrOpenAndClosed","color":"","bgcolor":"","icon":"","payload":"3","payloadType":"num","topic":"","x":190,"y":140,"wires":[["9c7f5b9e.f3e318"]]},{"id":"f99ebc1b.60c9","type":"debug","z":"63163740.2d4508","name":"","active":true,"tosidebar":true,"console":false,"tostatus":false,"complete":"true","x":750,"y":220,"wires":[]},{"id":"89295a31.c00768","type":"ui_group","name":"GPortSimulator 1","tab":"1309dc77.e283d4","order":13,"disp":true,"width":"6","collapse":false},{"id":"1309dc77.e283d4","type":"ui_tab","name":"TestBord","icon":"dashboard","order":1}]type or paste code here

Thanks for taking time for me!

Now I got to it (the inserted flow)

Make the debug pane wider to see all the buttons along the top to get at the dashboard options, or click the dropdown arrow at the right.

It looks like this. Have I missed something in installation ? ? ?

Try clearing the browser cache (not just forcing a page refresh). Also try a different browser.

How did you install node-red?

Please stop node red then start it again in a terminal and post the resulting log here. Copy/paste not screen shot if possible please.