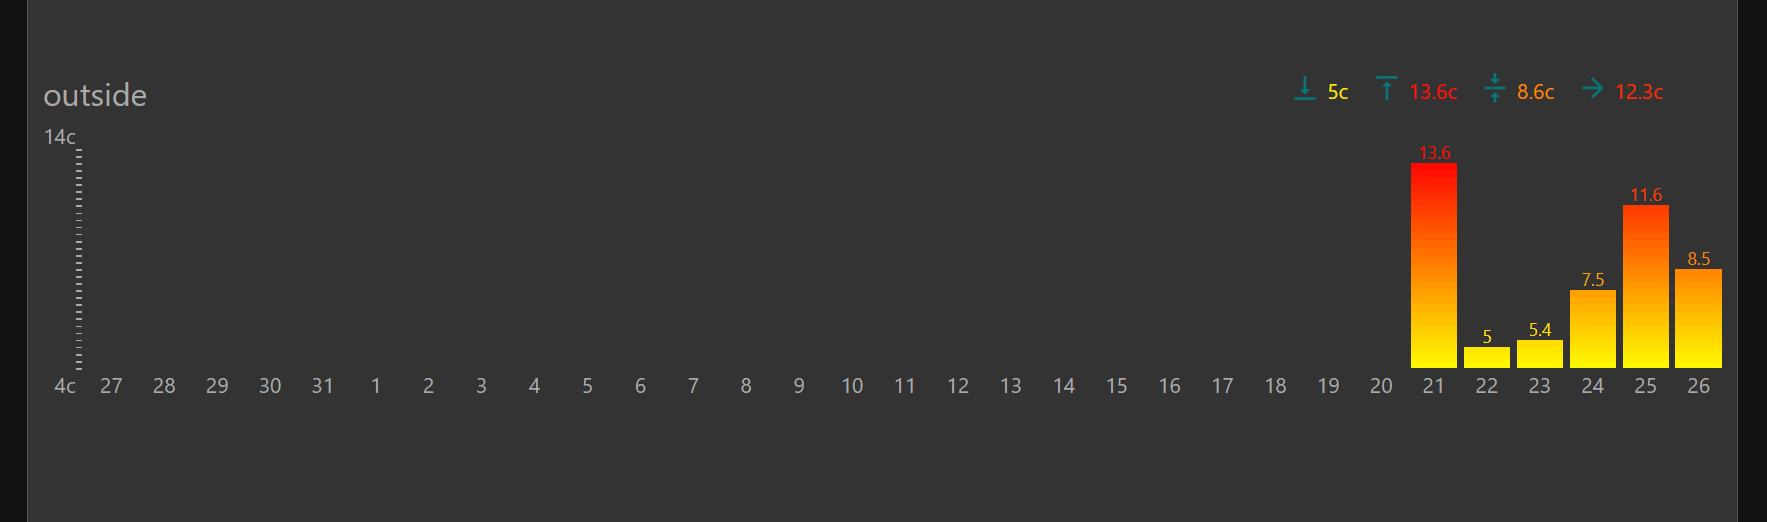
i am currently using mqtt average bars and template nodes to track the average daily temperatures, (copied and pasted from somewhere)but would like to have the same chart with just highest daily temperatures, I'm absolutely hopeless at this so any help would be great . thanks
martin
[
    {
        "id": "8cf6903579d0ffc9",
        "type": "mqtt in",
        "z": "e4c29118d59c6947",
        "name": "living room",
        "topic": "zone2/text",
        "qos": "2",
        "datatype": "auto-detect",
        "broker": "dc0340c9643bd396",
        "nl": false,
        "rap": true,
        "rh": 0,
        "inputs": 0,
        "x": 100,
        "y": 60,
        "wires": [
            [
                "0eec94515a4437c4"
            ]
        ]
    },
    {
        "id": "0eec94515a4437c4",
        "type": "average-bars",
        "z": "e4c29118d59c6947",
        "name": "average-bars",
        "title": "living room",
        "period": "month",
        "yMin": "auto",
        "yMax": "auto",
        "showBarsValue": true,
        "showScaleValue": true,
        "showLastValue": true,
        "showAverageValue": false,
        "showMinimumValue": true,
        "showMaximumValue": true,
        "maxBar": 30,
        "topColor": "#ff0000",
        "bottomColor": "#ffff00",
        "unit": "c",
        "fontColor": "#aaaaaa",
        "barStyle": "Rectangle",
        "decimal": 1,
        "x": 250,
        "y": 60,
        "wires": [
            [
                "334ecb64353a016b"
            ]
        ]
    },
    {
        "id": "334ecb64353a016b",
        "type": "ui_template",
        "z": "e4c29118d59c6947",
        "group": "b203668acaa94c76",
        "name": "",
        "order": 1,
        "width": "18",
        "height": 6,
        "format": "<div ng-bind-html=\"msg.payload\"></div>",
        "storeOutMessages": true,
        "fwdInMessages": true,
        "resendOnRefresh": true,
        "templateScope": "local",
        "className": "",
        "x": 400,
        "y": 60,
        "wires": [
            []
        ]
    },
    {
        "id": "dc0340c9643bd396",
        "type": "mqtt-broker",
        "name": "",
        "broker": "192.168.0.107",
        "port": "1883",
        "clientid": "",
        "autoConnect": true,
        "usetls": false,
        "protocolVersion": "4",
        "keepalive": "60",
        "cleansession": true,
        "autoUnsubscribe": true,
        "birthTopic": "",
        "birthQos": "0",
        "birthPayload": "",
        "birthMsg": {},
        "closeTopic": "",
        "closeQos": "0",
        "closePayload": "",
        "closeMsg": {},
        "willTopic": "",
        "willQos": "0",
        "willPayload": "",
        "willMsg": {},
        "userProps": "",
        "sessionExpiry": ""
    },
    {
        "id": "b203668acaa94c76",
        "type": "ui_group",
        "name": "Default",
        "tab": "723e0c03.ca8984",
        "order": 1,
        "disp": true,
        "width": 18,
        "collapse": false,
        "className": ""
    },
    {
        "id": "723e0c03.ca8984",
        "type": "ui_tab",
        "name": "daily trmperatures",
        "icon": "dashboard",
        "order": 2,
        "disabled": false,
        "hidden": false
    }
]