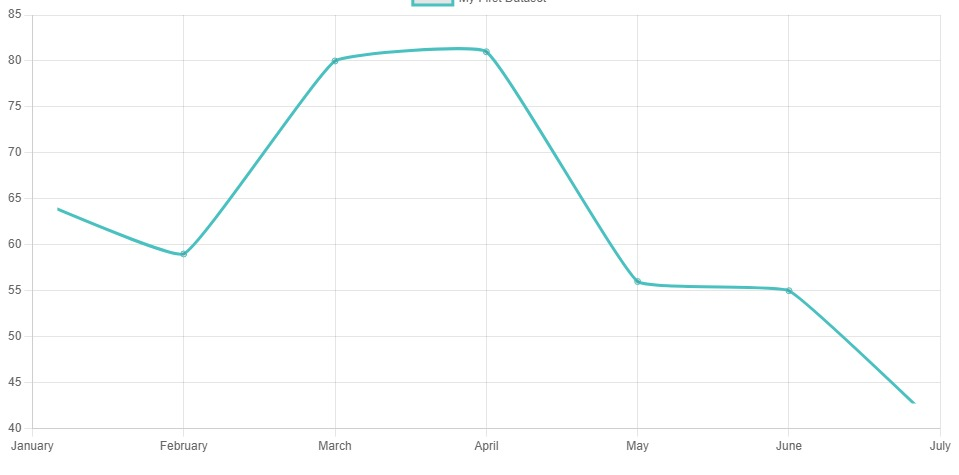
Not all chart.js options will apply to the ui-chart node. The ui-chart node dynamically builds the x and y axis'. for example if you have a value of 19, the y-axis will begin at 0, but if your lowest entry is 20, the y-axis will start at 20. If you go into your sample flow and change a valaue to 19, you will see the change.
For your x-axis starting with a ' ', will push Jan over on the x-axis giving you space.
You can create graphs using chart.js with a ui-template node (here is an example creating a bubble chart using chart.js: EXAMPLE: How to create a Bubble chart (can be used as basis for scatter plot too) (flow) - Node-RED) or use the node-red-contrib-chartjs node (I have no experience with it)
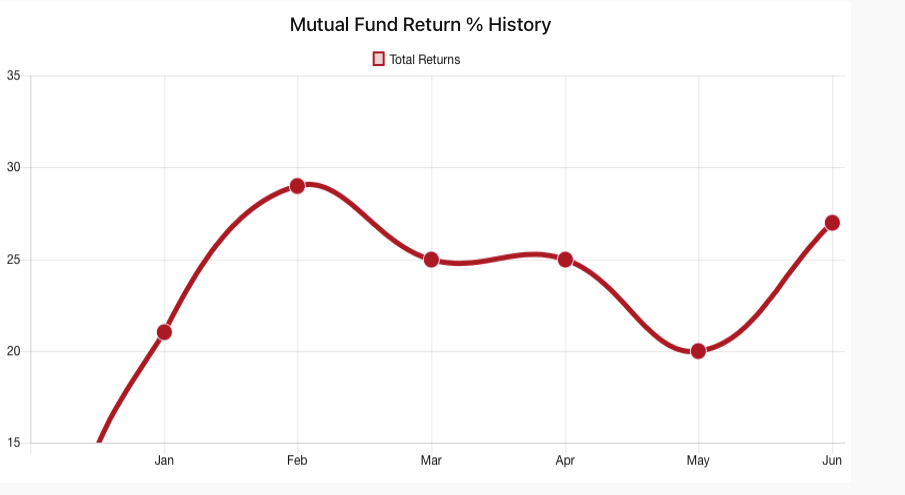
Here is your flow with the added " " and a data of 0 added.
[{"id":"cf654b95d23fcd66","type":"change","z":"a3faa9967eaf2dcb","name":"size","rules":[{"t":"set","p":"ui_control","pt":"msg","to":"{\"options\":{\"clip\":{\"left\":20,\"top\":50,\"right\":20,\"bottom\":-50},\"elements\":{\"line\":{\"borderWidth\":5,\"fill\":false},\"point\":{\"radius\":8}}}}","tot":"json"}],"action":"","property":"","from":"","to":"","reg":false,"x":470,"y":320,"wires":[["48206c8bed5e60d8"]]},{"id":"48206c8bed5e60d8","type":"ui_chart","z":"a3faa9967eaf2dcb","name":"Chart","group":"d08eb194.4f60d","order":7,"width":16,"height":9,"label":"Mutual Fund Return % History","chartType":"line","legend":"true","xformat":"HH:mm:ss","interpolate":"linear","nodata":"","dot":true,"ymin":"15","ymax":"35","removeOlder":1,"removeOlderPoints":"30","removeOlderUnit":"3600","cutout":0,"useOneColor":false,"useUTC":false,"colors":["#d1001f","#f10404","#d66400","#025f02","#130557","#9e0557","#ff9896","#9467bd","#c5b0d5"],"outputs":1,"useDifferentColor":false,"x":610,"y":320,"wires":[[]]},{"id":"d2004b5a7401348b","type":"inject","z":"a3faa9967eaf2dcb","name":"","props":[{"p":"payload"}],"repeat":"","crontab":"","once":false,"onceDelay":0.1,"topic":"","payload":"[{\"series\":[\"Total Returns\"],\"data\":[[0,21,29,25,25,20,27]],\"labels\":[\" \",\"Jan\",\"Feb\",\"Mar\",\"Apr\",\"May\",\"Jun\"]}]","payloadType":"json","x":300,"y":320,"wires":[["cf654b95d23fcd66"]]},{"id":"d08eb194.4f60d","type":"ui_group","name":"Mutual Fund Investment History","tab":"a9a5b115d50d9ca1","order":1,"disp":false,"width":"16","collapse":false},{"id":"a9a5b115d50d9ca1","type":"ui_tab","name":"Mutual Fund Investment History","icon":"dashboard","order":1,"disabled":false,"hidden":false}]