Dear Node-Red Community,
I know there are several thread about loosing connection but I could not find an answer for my problem anywhere.
I am trying to record some temp and humidity data from several sensors. Reading the sensor values and writing to files all works great.
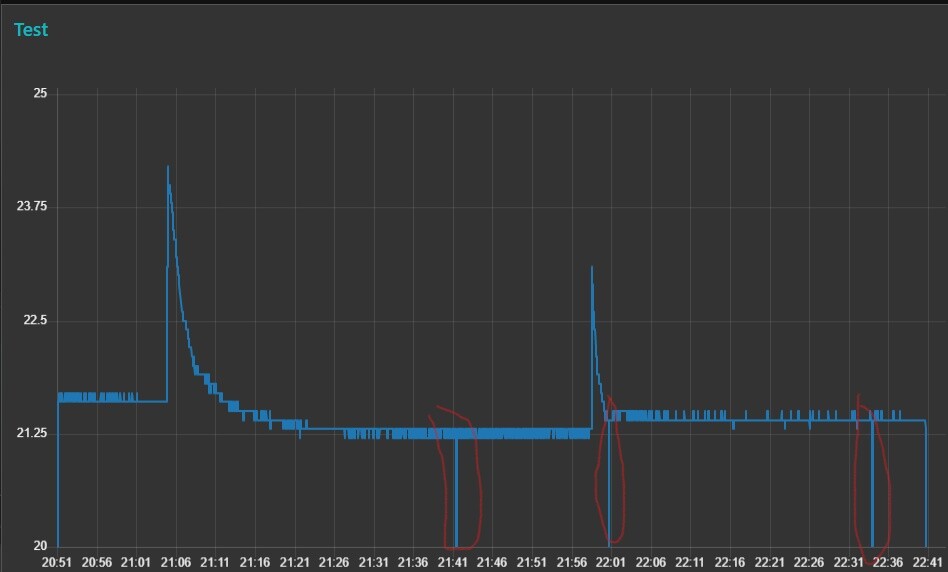
Now and then i get a "Connection Lost" popup and a gap in the recording of the sensor data occurs. This can also be seen on the chart. The longer the recording time, the more often the "connection lost" occurs.
After some time, the chromium browser on the pi has also crashed.
Do you have any ideas what kind of problem I am facing?
Good day,
I am updating every second but i dont think it has something to do with the chart as the connection problem occured before I added the chart as well.
I will do another testrun. refreshing the sensors every second, without chart.
I will also monitor the log and will report as soon as I am done.
OK I did another testrun without charts for about 1h.
Still the same problem. After some time (starting at around 10 min.) I get the "connection lost" popup, screen turns black and immediately comes back. All gauges regain their values starting from 0.
i tried to catch it on a screencast.
Whats strange is that the data drops are at different times for every sensor and seem to appear totally random. Also not consistent with the "connection lost" problem. It looks like the data is stored into my txt files even the connection is lost. So there might be two different problems here.
Looking at the log file, nothing unusual happening there.
What changed when i removed the chart was the crash of the chromium browser. Browser remaind stable during the whole testrun.
===================
29 Nov 13:52:54 - [info] Node-RED version: v1.2.2
29 Nov 13:52:54 - [info] Node.js  version: v12.19.0
29 Nov 13:52:54 - [info] Linux 5.4.72-v7+ arm LE
29 Nov 13:52:55 - [info] Loading palette nodes
29 Nov 13:53:01 - [info] Dashboard version 2.23.4 started at /ui
29 Nov 13:53:02 - [info] Settings file  : /home/pi/.node-red/settings.js
29 Nov 13:53:02 - [info] Context store  : 'default' [module=memory]
29 Nov 13:53:02 - [info] User directory : /home/pi/.node-red
29 Nov 13:53:02 - [warn] Projects disabled : editorTheme.projects.enabled=false
29 Nov 13:53:02 - [info] Flows file     : /home/pi/.node-red/flows_raspberrypi.j     son
29 Nov 13:53:02 - [info] Server now running at http://127.0.0.1:1880/
29 Nov 13:53:02 - [warn]
---------------------------------------------------------------------
Your flow credentials file is encrypted using a system-generated key.
If the system-generated key is lost for any reason, your credentials
file will not be recoverable, you will have to delete it and re-enter
your credentials.
You should set your own key using the 'credentialSecret' option in
your settings file. Node-RED will then re-encrypt your credentials
file using your chosen key the next time you deploy a change.
---------------------------------------------------------------------
29 Nov 13:53:02 - [info] Starting flows
29 Nov 13:53:02 - [info] Started flows
29 Nov 13:53:02 - [info] serial port /dev/ttyUSB0 opened at 115200 baud 8N1
As you are recording humidity & temperature data, so is it essential that it is recorded every second (is it going to change much in a second?).
If it's not essential, you could use a node-red-node-smooth node which would calculate the mean value of, for example every 10 inputs (1 output every 10 seconds), and output that data for drawing in the chart. That would reduce your memory requirements 10 fold, and maybe not make any visible difference to the chart plot display.
I update my temp & humidity charts every minute, and the charts load really quickly, and yet display smoothly.
I was hoping that you were going to post messages from your log leading up to it crashing (and not just the start log), as it will probably indicate why it's crashing.
Have you any other charts running on that server, maybe on a different tab (that are not shown in your screenshot.
Using a node-red-node-smooth node for the charts is a great idea. I will need crucial data changes around every second because Iam planing to control a heating chamber. Charts can refresh slower and use a node-smooth thats ok.
Thats all the log readings i have. After that last line there is no more...
No more charts and as I mentioned before I tested again without a chart to see if that could be the problem.
@hotNipi
Thats true, I will keep that in mind as soon as I put the chart back into the flow.
Fewer datapoints and shorter time period.
Another thing, I left it running for another 5h and chromium is still stable. So at least thats good news. This could actually be connected to the memory as I used a chart before with 1s datapoints and a realy long period and in this testrun removed all the charts.
Can you look in your /var/log/syslog for around the time at which the crash occured. You should see some entries labelled Node-REDleading up to the time of the crash, which will likely contain information about what caused the crash.
I don't know how 'mission critical' your project is, but be aware that as this will run single-threaded, and there could be slight delays in the system.
Ok we got the following:
The last line could be interesting but connection was lost a bunch of times before too.
> Nov 29 13:53:06 raspberrypi dhcpcd[568]: eth0: no IPv6 Routers available
Nov 29 13:53:18 raspberrypi systemd[1]: systemd-fsckd.service: Succeeded.
Nov 29 13:55:59 raspberrypi systemd-timesyncd[332]: Synchronized to time server for the first time 194.112.182.172:123 (2.debian.pool.ntp.org).
Nov 29 13:56:04 raspberrypi systemd[1]: systemd-hostnamed.service: Succeeded.
Nov 29 13:56:11 raspberrypi systemd[1]: Started Session 3 of user pi.
Nov 29 13:56:29 raspberrypi systemd[1]: Started Session 4 of user pi.
Nov 29 13:57:12 raspberrypi systemd[1]: session-4.scope: Succeeded.
Nov 29 14:10:28 raspberrypi systemd[1]: Starting Cleanup of Temporary Directories...
Nov 29 14:10:28 raspberrypi systemd[1]: systemd-tmpfiles-clean.service: Succeeded.
Nov 29 14:10:28 raspberrypi systemd[1]: Started Cleanup of Temporary Directories.
Nov 29 14:17:01 raspberrypi CRON[1024]: (root) CMD (   cd / && run-parts --report /etc/cron.hourly)
Nov 29 14:47:55 raspberrypi systemd[1]: Started Session 6 of user pi.
Nov 29 14:48:29 raspberrypi systemd[1]: session-6.scope: Succeeded.
Nov 29 14:55:29 raspberrypi rngd[381]: stats: bits received from HRNG source: 80064
Nov 29 14:55:29 raspberrypi rngd[381]: stats: bits sent to kernel pool: 34336
Nov 29 14:55:29 raspberrypi rngd[381]: stats: entropy added to kernel pool: 34336
Nov 29 14:55:29 raspberrypi rngd[381]: stats: FIPS 140-2 successes: 4
Nov 29 14:55:29 raspberrypi rngd[381]: stats: FIPS 140-2 failures: 0
Nov 29 14:55:29 raspberrypi rngd[381]: stats: FIPS 140-2(2001-10-10) Monobit: 0
Nov 29 14:55:29 raspberrypi rngd[381]: stats: FIPS 140-2(2001-10-10) Poker: 0
Nov 29 14:55:29 raspberrypi rngd[381]: stats: FIPS 140-2(2001-10-10) Runs: 0
Nov 29 14:55:29 raspberrypi rngd[381]: stats: FIPS 140-2(2001-10-10) Long run: 0
Nov 29 14:55:29 raspberrypi rngd[381]: stats: FIPS 140-2(2001-10-10) Continuous run: 0
Nov 29 14:55:29 raspberrypi rngd[381]: stats: HRNG source speed: (min=328.030; avg=404.045; max=830.163)Kibits/s
Nov 29 14:55:29 raspberrypi rngd[381]: stats: FIPS tests speed: (min=1.388; avg=3.336; max=14.213)Mibits/s
Nov 29 14:55:29 raspberrypi rngd[381]: stats: Lowest ready-buffers level: 2
Nov 29 14:55:29 raspberrypi rngd[381]: stats: Entropy starvations: 0
Nov 29 14:55:29 raspberrypi rngd[381]: stats: Time spent starving for entropy: (min=0; avg=0.000; max=0)us
Nov 29 15:04:33 raspberrypi Node-RED[372]: 29 Nov 15:04:33 - [warn] Communication send error: Error: WebSocket is not open: readyState 2 (CLOSING)
Hold on, I am confused now. @AldaSoggn said there wasn't anything in the node-red log around the time of the problem. @AldaSoggn is that correct or is node-red restarting by itself. In which case what happens before the restart is what matters, either in node-red-log or in syslog.
If OP starts the log by node-red-log - it would only show the log from the time that node-RED restarted, not the events leading up to the restart. That's why I asked about checking syslog because I'm pretty sure that there would be something listed if there is a problem causing node-RED to crash.
If memory issue is at dashboard, it is browser thing so I really doubt something usable shared to system about the reasons. You may see when but the why thing is something you should then figure out.
The thing to investigate may be the packet sizes going over the socket .. and then maybe the content of larger packets if such ..
I'm making this assumption because of this in the screenshot above;
Also that when OP checked his log in this post;
You will see that the log shows that node-RED started at 13:52 (and the post was made at 14:01), suggesting that it had either crashed or restarted just a few minutes earlier.
@AldaSoggn I don't think its helpful getting advice & comments from numerous people at the same time, so I'll back out, and let the other more experienced members advise you.
I hope that you get sorted
using the node-red-log I get the output listed in my second post.
I am checking the syslog now.
so far I am working through the data jungle. I will try to reprodice the connection error again to pin it to a log line. I will report as soon as I have some useful data
But was that as a result of manually stopping and starting node-red (which is what I asked you to do) or did it start at that point by itself? If it restarted by itself then what comes before that in syslog is the important thing.
I started and stopped node-red manually.
Looking through the syslog I could also not find any indications that node-red crashed and started itself automatically.
I had it run over night to see if something odd would appear in the syslog but since the start of the node-red service there are no more Node-RED entries.
Its kind of hard waiting and staring at the display until the "connection lost" popup appears to pin it to a log line but using screencast and the log times I could determine the exact time of the connection loss.
Unfortunately there is nothing happening in ether the node-red-log nor the syslog looking at this timestamp.
I am guessing when you use node-red-log it filters al the Node-RED entries from the syslog?
You will see that the log shows that node-RED started at 13:52 (and the post was made at 14:01), suggesting that it had either crashed or restarted just a few minutes earlier.
This is becaus I live in a different timezone. I posted at 15:01
OK, so you are seeing no unexpected messages in node-red-log (apart from a websocket error that you posted earlier, but you say that doesn't happen every time the connection is lost), and nothing obvious in syslog.
Can you run top in a terminal and watch to see if anything is hogging the processor? Also check the memory usage, though I think if that were the problem that there would be other symptoms.
I am not sure it has been asked already, but are you running the browser on the pi? If so then can you try running the browser on a PC instead?