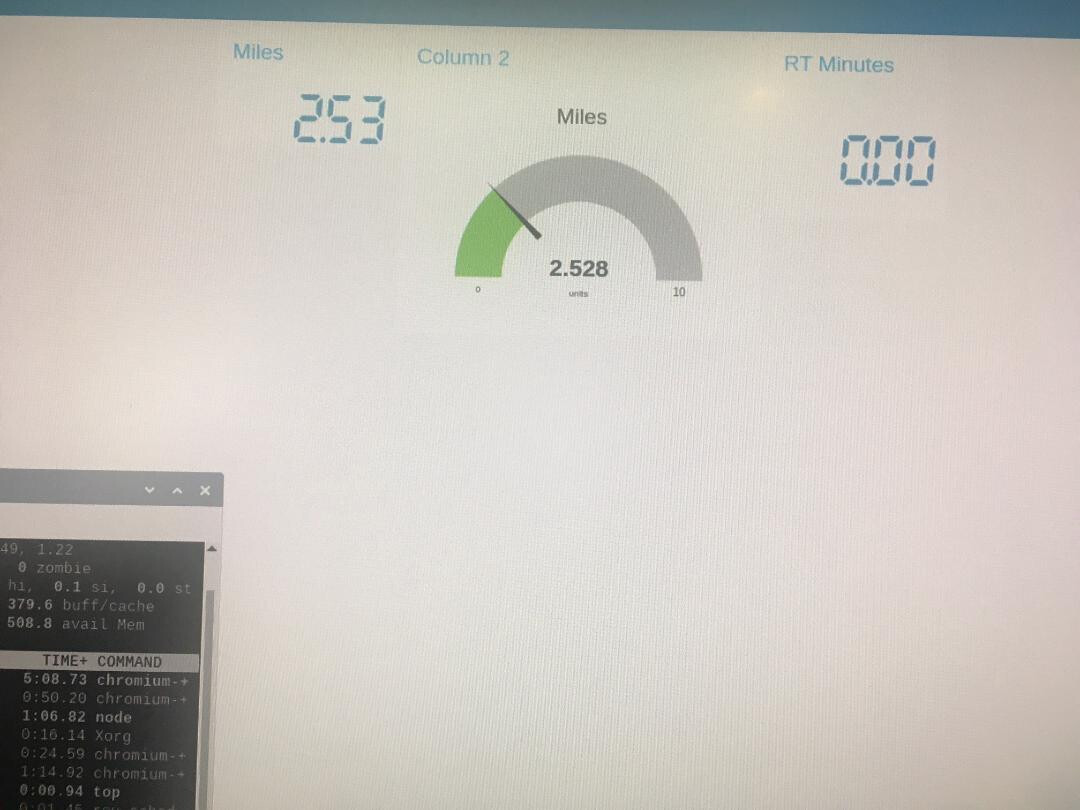
I am receiving external serial data from a SERIAL IN node and doing some arithmetic on the payload. Everything works flawlessly according to the debug nodes in the flow and it works fine when I initially switch to the dashboard to view the results.
But almost exactly every 30 seconds the dashboard view flashes the error "CONNECTION LOST". Everything reconnects in a second or two and all is well until after another 30 seconds when the behavior repeats.
Try stopping node-RED - node-red-stop and restart again node-red-start and watch the log.
You will probably see the point where node-RED stops & restarts, so copy the log, and paste it here so we can see what's happening.
Nothing pops up when the disconnect appears and the startup seems to be normal. I did notice that this only happens when I have the GAUGE in the group "COLUMN 2: active. Something about that is affecting this
29 Jan 14:19:29 - [info] Linux 4.19.118-v7+ arm LE

29 Jan 14:19:31 - [info] Loading palette nodes

29 Jan 14:19:37 - [info] Dashboard version 2.27.0 started at /ui

29 Jan 14:19:37 - [info] Settings file : /home/pi/.node-red/settings.js

29 Jan 14:19:37 - [info] Context store : 'default' [module=memory]

29 Jan 14:19:37 - [info] User directory : /home/pi/.node-red

29 Jan 14:19:37 - [warn] Projects disabled : editorTheme.projects.enabled=false

29 Jan 14:19:37 - [info] Flows file : /home/pi/.node-red/flows_raspberrypi.json

29 Jan 14:19:37 - [info] Server now running at http://127.0.0.1:1880/

29 Jan 14:19:37 - [warn]

---------------------------------------------------------------------

Your flow credentials file is encrypted using a system-generated key.

If the system-generated key is lost for any reason, your credentials

file will not be recoverable, you will have to delete it and re-enter

your credentials.

You should set your own key using the 'credentialSecret' option in

your settings file. Node-RED will then re-encrypt your credentials

file using your chosen key the next time you deploy a change.

---------------------------------------------------------------------

29 Jan 14:19:37 - [info] Starting flows

29 Jan 14:19:38 - [info] Started flows

29 Jan 14:19:38 - [info] serial port /dev/ttyAMA0 opened at 115200 baud 8N1
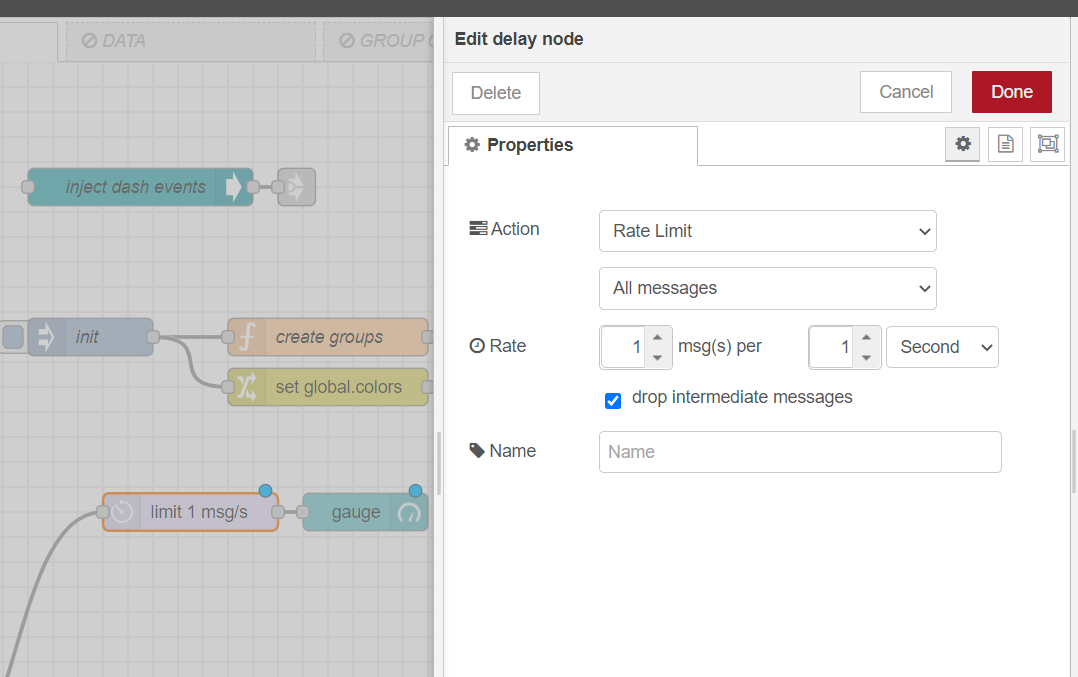
There seems to be a speed limit to how fast the GAUGE node can update and I was apparently exceeding that limit. When I limit the number of decimals coming into GAUGE to 2 instead of 3, it updates more slowly and the CONNECTION crash goes away.
Any widget with animations involved will make high rate updates very hard to handle. It is not possible to turn off the animations for ui_gauge node but you can use the artless-gauge with animations turned off. But anyway, updating the gauge with high rate makes it pretty unreadable. So rate limit is reasonable thing to do.
I imagine the main problem is running the browser on a pi3 with the node red dashboard and fairly rapid refresh rates. A pi 3 is barely powerful enough for that. You would have a much better experience if you upgraded to a pi 4.