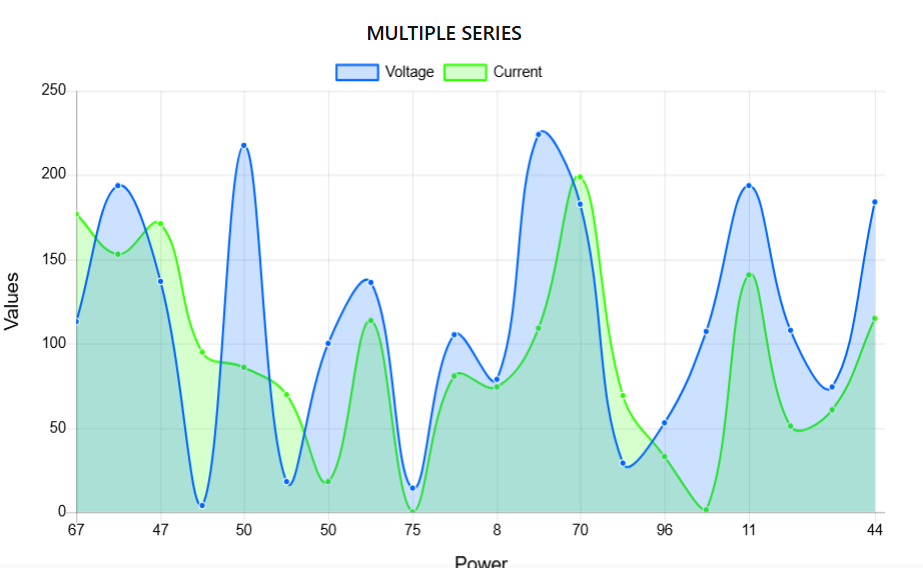
Hello there I’m currently working on an IoT project so I had the need to customize Node-RED charts so what I did was to use a function before the chart where I modify all the settings for the chart so I can visualize it better. I couldn’t really find a lot of easy info on it. So hopefully this will help some people save some time. Here is an example of what I could pull off, also the YouTube link where I explain what I did in detail with the GitHub repo.
Edit: I am using the “node-red-dashboard” library v 3.6.6 to get the charts.