My Node-RED application has 5 flow and 8 subflow, when exporting all in JSON format the total size is 1.25 MB.
Each time I click the Deploy button, it takes a long time to complete, about 9 minutes each time.
I think that the deployment time is long, right?
In the project, subflow calls each other, for example subflow A calls subflow B and subflow C, subflow B calls subfow D (because subflows contain common part of flows)
Could calling between subflows like this cause the long deploy times?
You has met or has experience in this situation please tell me!
Thanks!
I dont think it is even worth exploring any potential issues until you update. V0.20.7 is REALLY old. I would strongly suggest updating to latest version (see docs).
The usual cause of a hang like this will be a node taking some time to stop.
If you set the logging level to 'trace' in your settings file, then you should see a lot more detail on what is happening during the deploy. You should see a log statement for when it asks each node to stop, and another when each node has stopped.
It will take some work to do - but you should be able to narrow down what node (if any) is causing the delay.
That said, I simply can't remember if 0.20.7 has those log statements in or not - you'll just have to try.
This means that subflow calls are not the cause of time-consuming deployments!!!
Yes, I will update later...
I deploy full.
This is not clear to me, I open PC and work mostly with Node-RED.
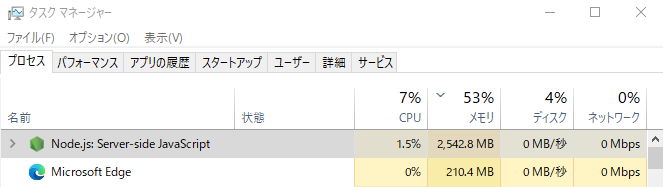
But I also have a question that the Node JS service takes up very high memory 1,7GB ~ 3,1GB.
Is this unusual?
I also think there is a possibility that some node makes deploying long,
but in the project there are too many nodes, manual shrinking takes time,
so is there a way to output the deploy time log file of each node?
It is also possible that this is a possibility ... (y)
I just restarted Node-RED, complete memory about 1.7GB
Then:
① I go to subflow > double click on the catch node, check 2 more node names, the purpose is to change the catch node.
② Change [deploy full] to [depoy node]
③ Click the Deploy button
After clicking the Deploy button, the memory increases continuously, up to about 4GB ~
The total deployment time has not changed much compared to [deploy full] 8 minutes ~ 9 minutes
If you watch the log when you hit deploy you should be able to see a long pause somewhere between log events saying what nodes have stopped.... that should be all the information you need to identify which nodes took a long time.
Yes, as you said, the root issue has not been addressed.
I know how to output the start and end time of a node's execution at runtime,
but I don't know how do I calculate the start and end time at the deployment time of a node.
I tried google search but no result, if you know, please tell me or any hint will be great!
I think the idea is that you watch the log while you deploy. At some point it will stop for most of 9 minutes. Hopefully you will be able to see from the log at that point what is trying to do. Copy the last lines from the log and paste them somewhere. Also hit enter a few times which will put some blank lines on the screen. Then when it starts again you will be able to scroll back and find where the pause was so you can see what the first lines after it got going were.
I set the output log 'trace' to the file
> Then start Node-RED
> Switch deploy to [deploy full]
> Change the node and click Deploy, after deploying complete see 'trace' log, the whole time will be output in succession without any interruptions, like below (1 part of log, all about 332502 rows)
So when does the delay occur? If you watch the output as it is produced by stopping node red then restarting it in a terminal at what point does the delay occur?
In a terminal stop node red, then start it again. You should see the startup log appearing in the terminal. Watch it appearing when you deploy and note at what point the 10 second delay happens.
If the output does not stop but just keeps going for the full 10 seconds post it here as an attachment using the Upload button to attach it to your post.