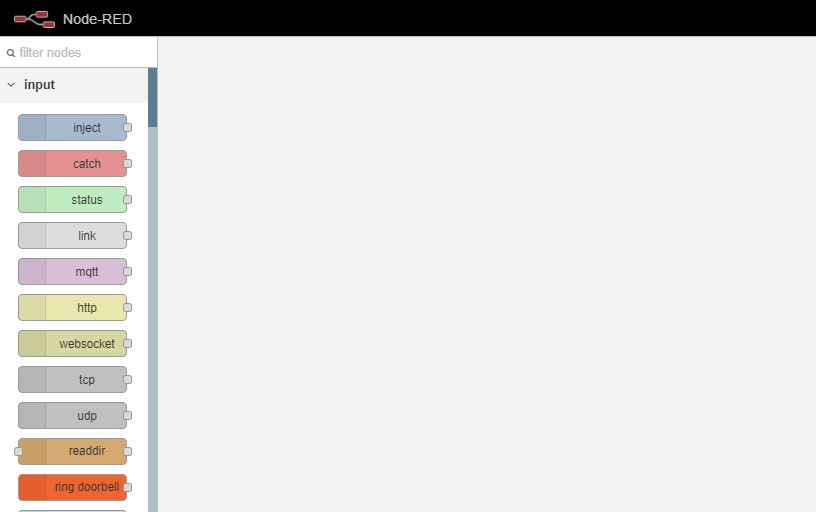
Increasingly, whenever I open the node-RED editor (v0.20.5) the editor page opens fine, but the flows are missing, and I have a blank workspace as per the screenshot below.
Quite often reloading the page (F5) restores the flows, but sometimes takes several attempts.
There are no issues reported in NR log, however using browser tools, I am seeing
Failed to load resource: net::ERR_SPDY_PROTOCOL_ERROR 200
A google check of that error offers a number of solutions, clearing the browser cache (which helps for a while), flushing the sockets, etc, which don't appear to make much difference.
Browser - Chrome Version 74.0.3729.131 (Official Build) (64-bit).
Node-RED running on RasPi 3b+, and served https via cloudflare.
Any suggestions please.
I suspect this will be related to your use of cloudflare Infront of Node-RED.
A quick search finds this thread that suggests disabling http2 in your cloudflare configuration. https://community.cloudflare.com/t/net-err-spdy-protocol-error-200/40889/2
Unfortunately, HTTP/2 is enabled by default on all Cloudflare accounts, and can only be disabled by having a paid plan 
However, I did see this post about Cloudflare depreciating SPDY in Feb 2018, and I wonder if this could be part of the problem?
On the same Pi, I host Grafana and do not have this problem, and also node-RED dashboards, which again work fine. So unsure why it is only affecting the node-RED editor...
Are you using any kind of anti-malware tool that is adding something to Chrome? Maybe try using an in-private browsing session so that you don't have any extensions loaded. One post seems to suggest that the AVAST AV tool may cause this for example.
This post also suggests a header issue with content length. But it also says that you can disable SPDY on free plans using the API - bit of an old post though so it might not be up to date.
Here is another post that suggests a header problem.
There appear to be lots of reasons this error can occur - no wonder that it is being deprecated.
Oh, and I note that Cloudflare uses NGINX which is mentioned in a number of posts examining this error.
Thanks Julian.
I've tried incognito mode and it's still the same unfortunately, and am getting the error probably 30% of the time. I'm not using Avast.
What's confusing is that only the node-RED editor is revealing this issue, not grafana or NR dashboards. Even the editor page loads ok - just not the flows....
Could it be a node-RED issue?
You might have to compare headers between access via Cloudflare and direct access? That might turn up a clue maybe?
Not an easy task, as my server is locked to Cloudflare's IP's, and via certificates.
I'm going to try using MS Edge browser for a few days to see if it's just limited to Chrome or not.
Well... it gradually got worse, and I couldn't access my node-RED editor 'flows' at all, from any browser, even a mobile browser.
However, after delving through the Cloudflare menus, I found a setting - 'Browser Cache Expiration' which was set to 8 days, and had been set that way for over 2 years without any problems whatsoever.
Changing this setting to 'Respect Existing Headers' and clearing the Cloudflare cache, immediately enabled the flows to load OK across all browsers.
I reversed the process to check a further twice, and on each occasion that the setting was other than 'Respect Existing Headers', the flow's refused to load.
Sorted!
Good find. Thanks for sharing, I've bookmarked this in case it comes up again.