I have created a flow to (somewhat) track the daily Corona virus via worldmap, it retrieves (yesterday's) statistics from github and produces a map.

Flow posted here:
https://flows.nodered.org/flow/3bfc75934d243f528867852c55bb64a1
I have created a flow to (somewhat) track the daily Corona virus via worldmap, it retrieves (yesterday's) statistics from github and produces a map.
Flow posted here:
https://flows.nodered.org/flow/3bfc75934d243f528867852c55bb64a1
Very appropriate! May I make one suggestion, in the second function node near the botton add
if(confirmed === 0){
  return
}
or set the color green for locations with no known cases.
if(confirmed === 0){
    c = "#33cc33"
}
UPDATE: or maybe not, the green makes it looks even scarier because there are sow few..
I thought there was no data with 0, but perhaps there is (?)
Alaska, Idaho, West Virginia, Israel, China (Shanxi)...
I only see eight green dots which is why it looks so scary.
[{"id":"4be54a55.e1fd34","type":"http request","z":"f4476753.01ac2","name":"","method":"GET","ret":"txt","url":"","tls":"","x":150,"y":180,"wires":[["fb43bee6.f65f08"]]},{"id":"fb43bee6.f65f08","type":"csv","z":"f4476753.01ac2","name":"","sep":",","hdrin":true,"hdrout":"","multi":"one","ret":"\\n","temp":"","skip":"0","x":150,"y":220,"wires":[["2e960103.ead306"]]},{"id":"788dd8b1.c090e","type":"function","z":"f4476753.01ac2","name":"","func":"function getFormattedDate(date) {\n let year = date.getFullYear();\n let month = (1 + date.getMonth()).toString().padStart(2, '0');\n let day = date.getDate().toString().padStart(2, '0');\n \n return month + '-' + day + '-' + year;\n}\n\nvar date = new Date();\ndate.setDate(date.getDate() - 1);\nyesterday = getFormattedDate(date)\n\nurl = \"https://raw.githubusercontent.com/CSSEGISandData/COVID-19/master/csse_covid_19_data/csse_covid_19_daily_reports/\"+yesterday+\".csv\"\n\nreturn {url:url}","outputs":1,"noerr":0,"x":130,"y":140,"wires":[["4be54a55.e1fd34"]]},{"id":"dbdde3.24c40a2","type":"status","z":"f4476753.01ac2","name":"","scope":null,"x":120,"y":60,"wires":[["20986552.bfa8b2"]]},{"id":"20986552.bfa8b2","type":"switch","z":"f4476753.01ac2","name":"","property":"status.text","propertyType":"msg","rules":[{"t":"cont","v":"connected","vt":"str"}],"checkall":"true","repair":false,"outputs":1,"x":130,"y":100,"wires":[["d1d95f12.636c98"]]},{"id":"2e960103.ead306","type":"function","z":"f4476753.01ac2","name":"","func":"Number.prototype.between = function(a, b) {\n var min = Math.min(a, b),\n max = Math.max(a, b);\n\n return this > min && this < max;\n};\n\n//////////\n\nm = msg.payload\n\nconfirmed = m.Confirmed;\ndeaths = msg.payload.Deaths\ncountry = m[\"Country/Region\"]\n\nif(m.hasOwnProperty(\"Province/State\")){\n province = \"(\"+m[\"Province/State\"]+\")\"\n} else{\n province = \"\"\n}\nlon = m.Longitude\nlat = m.Latitude\n\n\nif(confirmed>1000){\n c = \"#D9100D\" \n}\nif(confirmed.between(750,1000)){\n c = \"#D9340D\" \n} \nif(confirmed.between(500,750)){\n c = \"#D9590D\" \n} \nif(confirmed.between(250,500)){\n c = \"#D97D0D\" \n} \nif(confirmed.between(100,250)){\n c = \"#D9A20D\" \n} \nif(confirmed.between(50,100)){\n c = \"#D9B40D\" \n} \nif(confirmed.between(1,50)){\n c = \"#D3D408\" \n} \n\n \n\ntooltip = `Country: ${country} ${province}<br/>Confirmed: ${confirmed}<br/>Deaths: ${deaths}<br/>`\nlabel = country +\" \"+province\nreturn {payload:{name:label,lon:lon,lat:lat,popup:tooltip,\"icon\":\"fa-circle\",iconColor:c}}","outputs":1,"noerr":0,"x":150,"y":260,"wires":[["d494c285.9c1e5"]]},{"id":"d494c285.9c1e5","type":"worldmap","z":"f4476753.01ac2","name":"","lat":"50.76","lon":"2.56","zoom":"3","layer":"Esri Dark Grey","cluster":"0","maxage":"","usermenu":"show","layers":"show","panit":"false","panlock":"false","zoomlock":"false","hiderightclick":"false","coords":"none","showgrid":"false","path":"/corona","x":150,"y":300,"wires":[]},{"id":"d1d95f12.636c98","type":"switch","z":"f4476753.01ac2","name":"","property":"status.text","propertyType":"msg","rules":[{"t":"cont","v":"connected 0","vt":"str"},{"t":"else"}],"checkall":"true","repair":false,"outputs":2,"x":250,"y":100,"wires":[[],["788dd8b1.c090e"]]}]
This should make it work a bit better with multiple connections
Could you please edit your post and use the correct formatting ?
and btw @JayDickson - it will not work better, because if it's connected 0 (meaning none), you are going to retrieve the data.

Small update, removed 0 confirmed as suggested and better filter for the connected part (distinct connected 0 and the rest), status node with selection for the map only.
updated the one I have above for multiuser and a bit better API etiquette, but I think your filter is a bit more elegant.
I've been tracking the data in Excel for a few days since I wanted to track confirmed cases by country population (e.g. cases as a % of population). I also wanted charts that used log10 Y axis rather than linear. These are quite revealing.
Started to convert that to Node-RED just as an interesting exercise but then discovered https://www.worldometers.info/ which has all sorts of interesting information including world population and lots of interesting COVID-19 stats.
Just for fun, if you want to extract the world population stats from their website, here is an example flow. Note that this renames some of the countries so that they fit with the WHO data from the Johns Hopkins GitHub repo that is used in the above example.
[{"id":"2507da13.824146","type":"inject","z":"769ea95b.9e7518","name":"","topic":"","payload":"","payloadType":"str","repeat":"","crontab":"","once":false,"onceDelay":0.1,"x":135,"y":280,"wires":[["3755e11c.d6bb5e"]],"l":false},{"id":"3755e11c.d6bb5e","type":"http request","z":"769ea95b.9e7518","name":"GET Population by Country","method":"GET","ret":"txt","paytoqs":false,"url":"https://www.worldometers.info/world-population/population-by-country/","tls":"","persist":false,"proxy":"","authType":"","x":300,"y":280,"wires":[["3d0f890f.c5d366"]]},{"id":"4067a8a5.2acd68","type":"debug","z":"769ea95b.9e7518","name":"","active":false,"tosidebar":true,"console":false,"tostatus":false,"complete":"false","x":810,"y":280,"wires":[]},{"id":"3d0f890f.c5d366","type":"cheerio-function","z":"769ea95b.9e7518","name":"","func":"// Get table title\nconst tblTitle = msg.payload=$('.content-inner > div > h1').text()\nconst tblDesc = msg.payload=$('.content-inner > div > p').html()\nconst tblSrc = msg.payload=$('.source-table').html()\n\nconst tableSelector = '#example2'\n\n// msg.payload=$('#example2').text();\n// return msg;\n\nconst options = {\n rowForHeadings: 0, // extract th cells from this row for column headings (zero-based)\n ignoreHeadingRow: true, // Don't tread the heading row as data\n ignoreRows: [],\n}\nconst jsonReponse = []\nconst jsonReponseObj = {}\nconst columnHeadings = []\n\n$(tableSelector).each(function(i, table) {\n var trs = $(table).find('tr')\n\n // Set up the column heading names\n getColHeadings( $(trs[options.rowForHeadings]) )\n\n // Process rows for data\n $(table).find('tr').each(processRow)\n})\n\nmsg.payload = {\n title: tblTitle,\n description: tblDesc,\n source: tblSrc,\n columnHeadings: columnHeadings,\n rows: jsonReponse,\n countries: jsonReponseObj,\n}\n\nreturn msg\n\nfunction getColHeadings(headingRow) {\n const alreadySeen = {}\n\n $(headingRow).find('th').each(function(j, cell) {\n let tr = $(cell).text().trim()\n\n if ( alreadySeen[tr] ) {\n let suffix = ++alreadySeen[tr]\n tr = `${tr}_${suffix}`\n } else {\n alreadySeen[tr] = 1\n }\n\n columnHeadings.push(tr)\n })\n}\n\nfunction processRow(i, row) {\n const rowJson = {}\n\n if ( options.ignoreHeadingRow && i === options.rowForHeadings ) return\n // TODO: Process options.ignoreRows\n\n $(row).find('td').each(function(j, cell) {\n let mycell = $(cell).text().trim()\n if ( mycell === 'United States' ) mycell = 'US'\n else if ( mycell === 'South Korea' ) mycell = 'Korea, South'\n else if ( mycell === 'Czech Republic (Czechia)' ) mycell = 'Czechia'\n else if ( mycell === 'Taiwan' ) mycell = 'Taiwan*'\n else if ( mycell === 'Congo' ) mycell = 'Congo (Kinshasa)'\n else if ( mycell === 'Côte d\\'Ivoire' ) mycell = 'Cote d\\'Ivoire'\n else if ( mycell === 'Réunion' ) mycell = 'Reunion'\n rowJson[ columnHeadings[j] ] = mycell\n })\n \n // Skip blank rows\n if (JSON.stringify(rowJson) !== '{}') {\n jsonReponse.push(rowJson)\n jsonReponseObj[rowJson['Country (or dependency)']] = (rowJson)\n }\n}\n\n//EOF","outputs":1,"noerr":0,"x":455,"y":280,"wires":[["9bda43ae.f39a1"]],"l":false},{"id":"9bda43ae.f39a1","type":"change","z":"769ea95b.9e7518","name":"flow.populations (file)","rules":[{"t":"set","p":"#:(file)::populations","pt":"flow","to":"payload","tot":"msg"}],"action":"","property":"","from":"","to":"","reg":false,"x":600,"y":280,"wires":[["4067a8a5.2acd68"]]}]
Sorry, should have said that the function node actually uses the cheerio-function node which you would need to install. This gives you a special function node with the Cheerio library fully exposed for advanced extract and manipulation of HTML.
I think the confirmed cases number will very soon become virtually meaningless (if it isn't already). In the UK those suffering non-severe symptoms are being advised to self-isolate and are not going to be tested, so they will not be included in any confirmed cases total. I imagine the same is true in many other parts of the world, that those suffering mild symptoms will not be counted. I heard someone say the other day that they think the actual number who have had it in Italy is likely to be ten or more times the confirmed cases number.
Yes agreed, the numbers don't say much anymore, which is why i said "to (somewhat) track", just thought it was a nice exercise.
Indeed. And I notice that the source hasn't been updated for 24 hours now. It has been updating twice per day.
The mortality figures are probably more accurate.
I only did it as an exercise in data analysis.
For UK data, I check https://www.gov.uk/government/publications/covid-19-track-coronavirus-cases which is still being updated.
Maps are very cool.
Generally speaking, everyone I know (including some doctors from the UK) visits this site for up-to-date worldwide corona virus info:
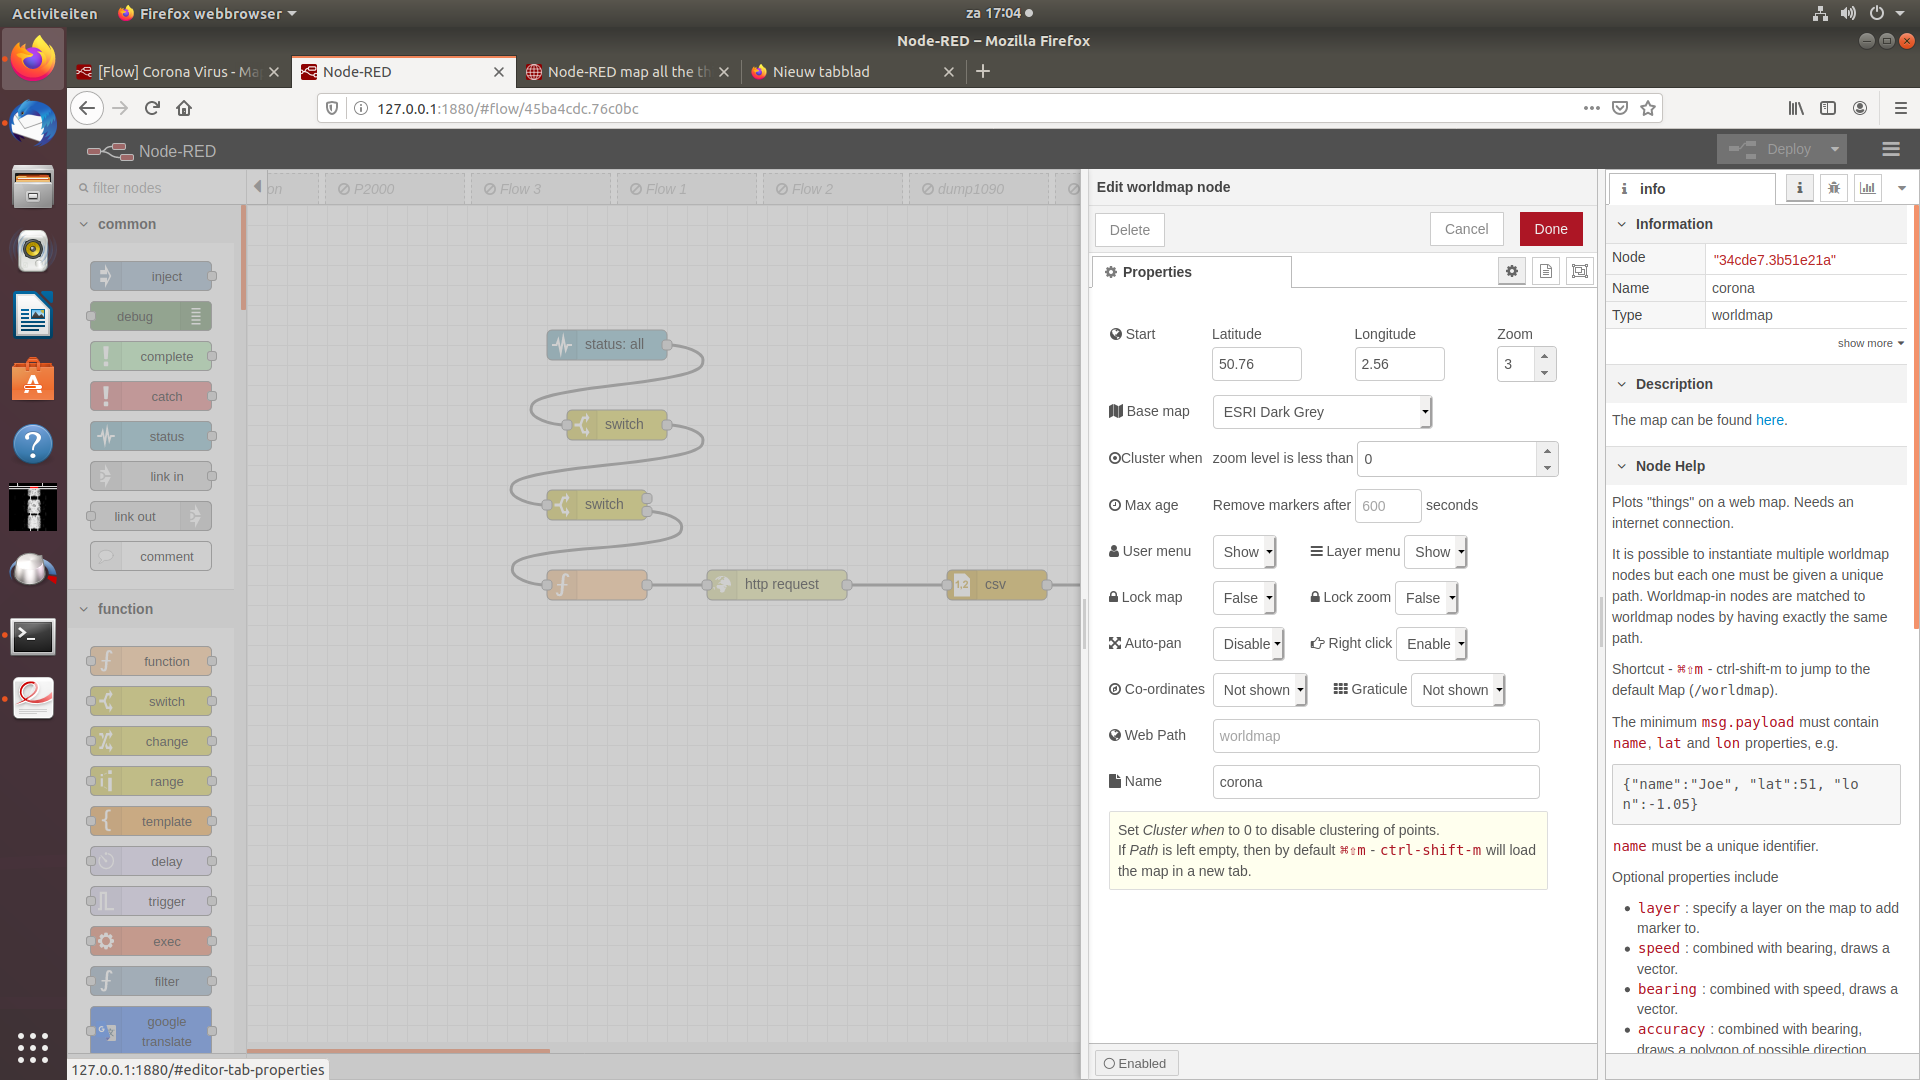
How does this flow work.
I copied it and put it in node-red, but it dont work in worldmap
I have just discovered node-red myself and am not yet well versed
My country is the Netherlands.
They use the same source + other sources.
Worldometer has always been great for the stats.
What doesnt work? Did you install worldmap (not the dashboard version).
Nothing happens when I start the flow. I have put on Deploy.
I am not yet familiar with node-red.
It has worldmap on it, but I don't know if this is the dashboard version.
node-red-contrib-web-worldmap is installed
Do I have to make some adjustments to some nodes
Hopefully you understand a bit.
I work with a translator because my english is not good.
Copyright OpenJS Foundation and Node-RED contributors. All rights reserved. The OpenJS Foundation has registered trademarks and uses trademarks. For a list of trademarks of the OpenJS Foundation, please see our Trademark Policy and Trademark List. Trademarks and logos not indicated on the list of OpenJS Foundation trademarks are trademarks™ or registered® trademarks of their respective holders. Use of them does not imply any affiliation with or endorsement by them.
The OpenJS Foundation | Terms of Use | Privacy Policy | OpenJS Foundation Bylaws | Trademark Policy | Trademark List | Cookie Policy