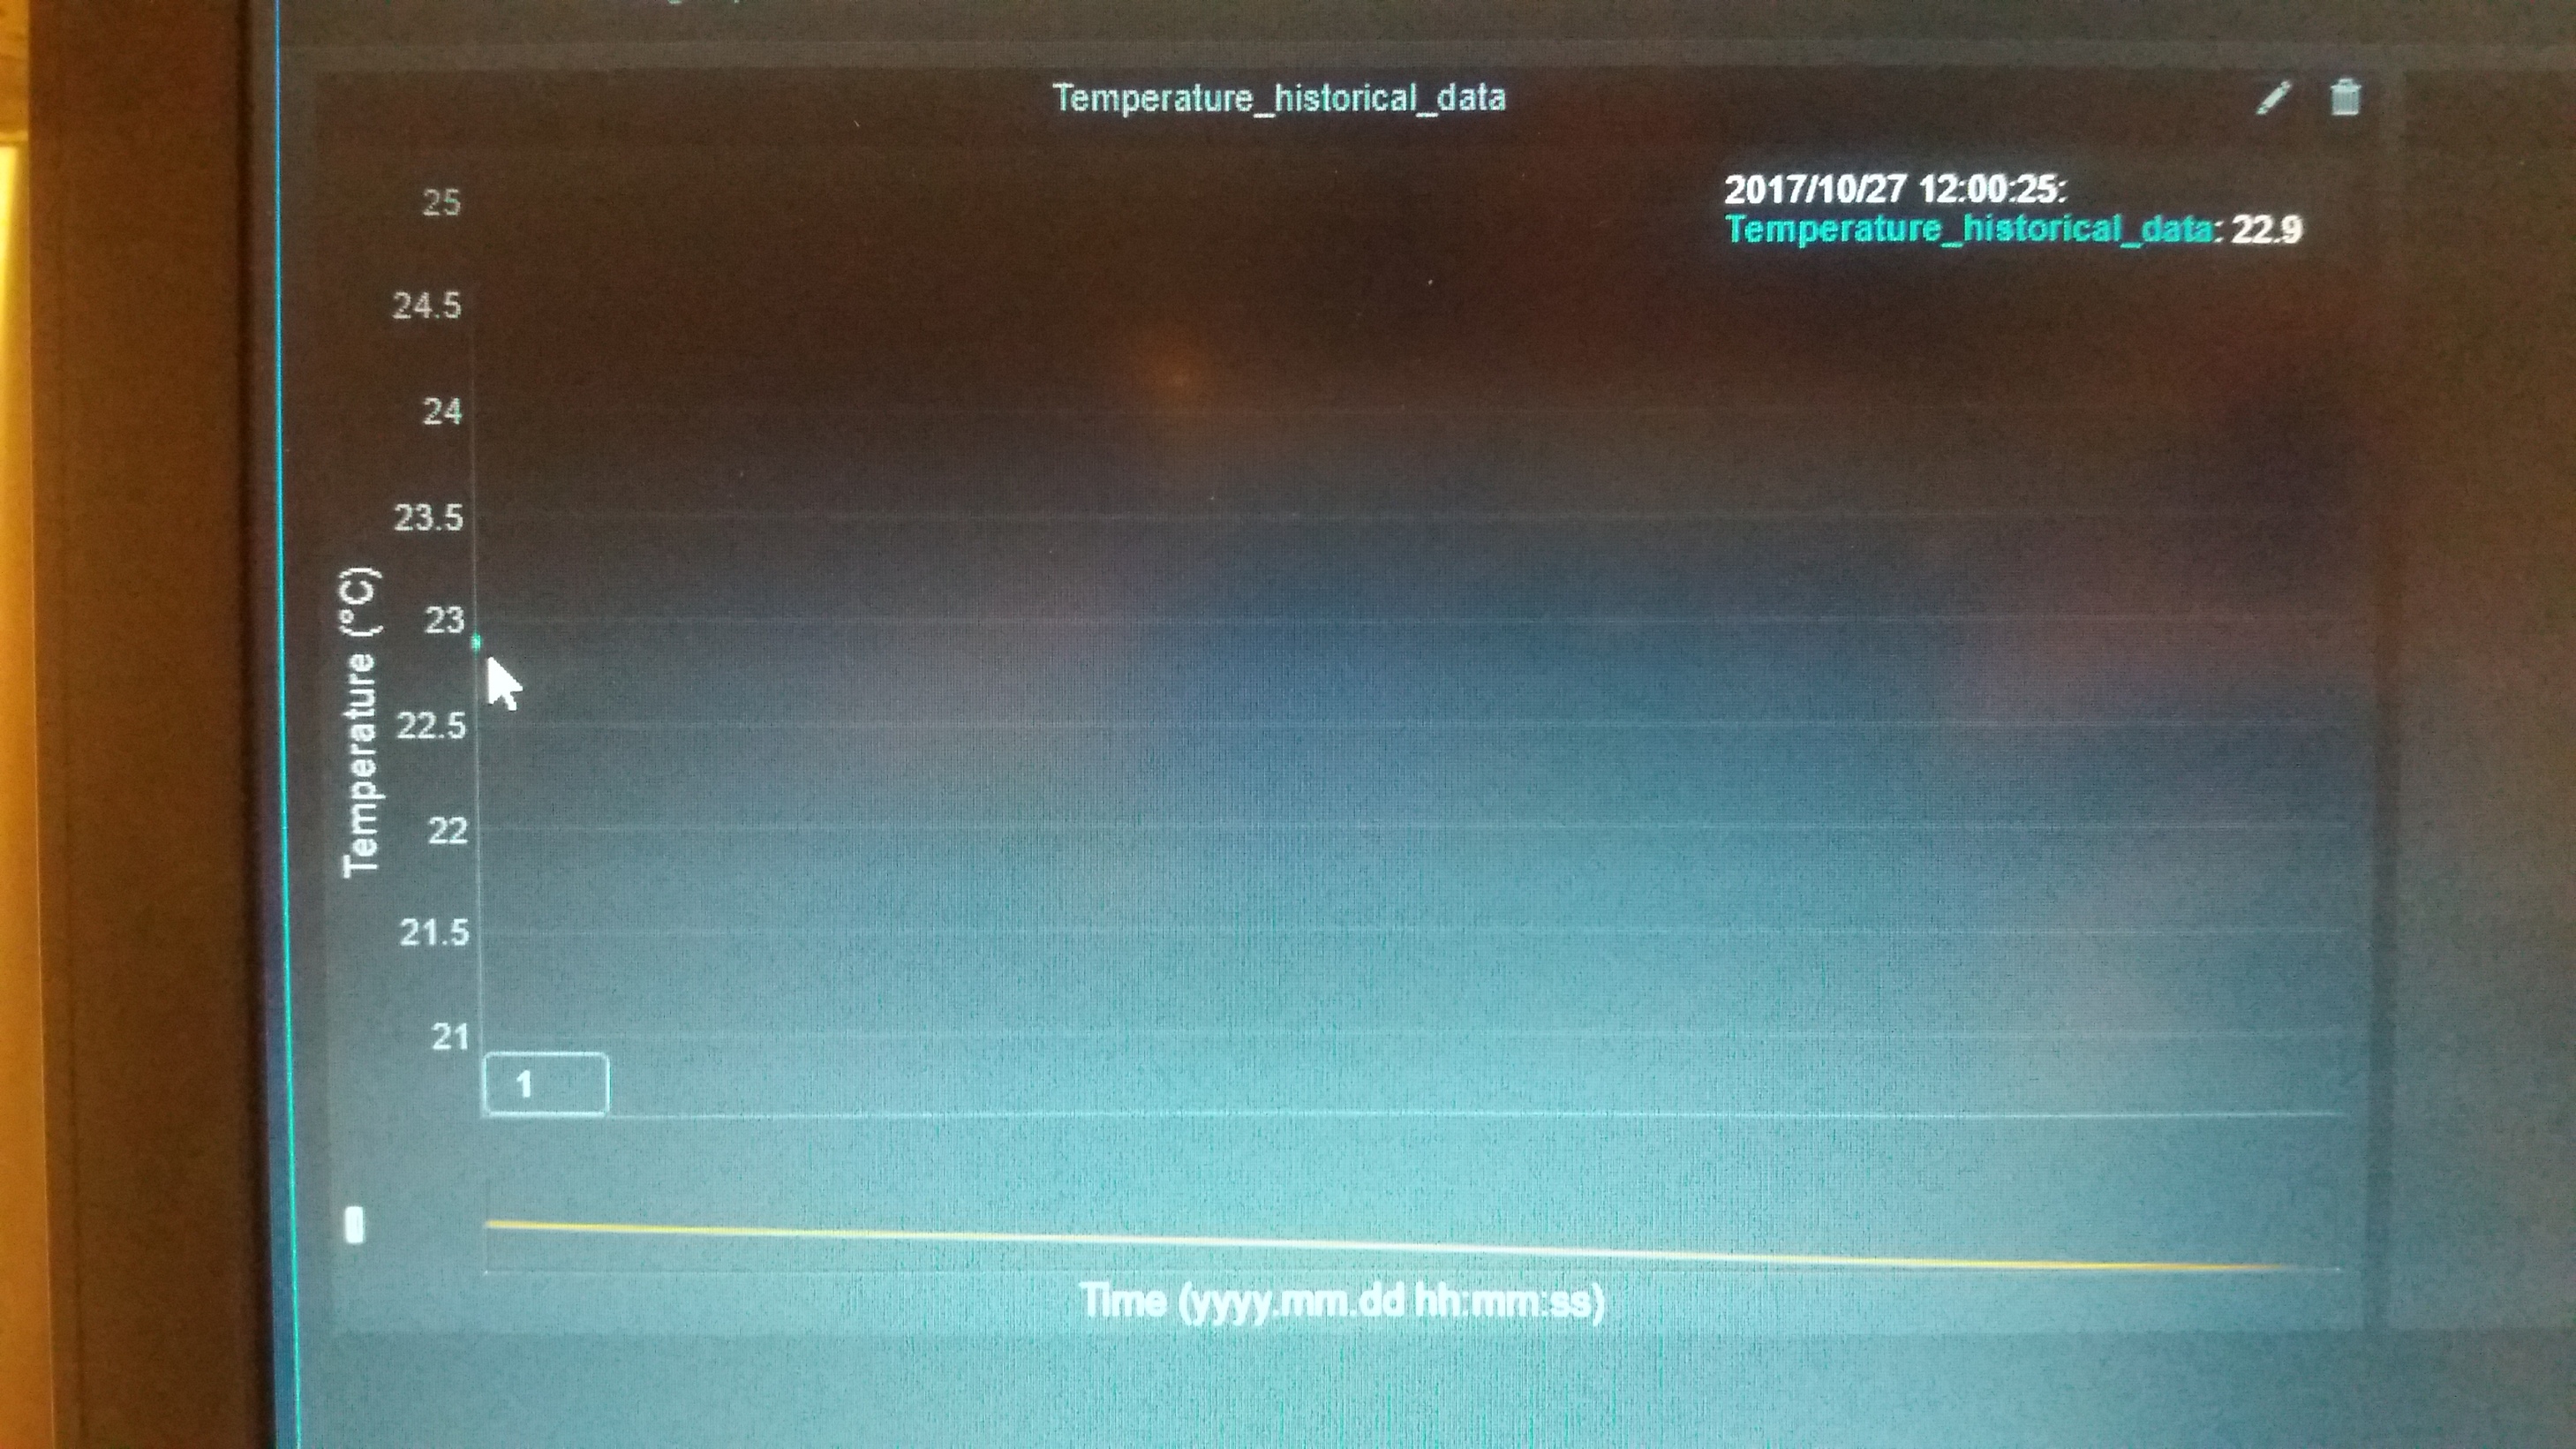
I tried the examples and the graphics appear with no problems. I am only using the dashboard of the datasource node. I think my problem is in the function in the conversion of the date (2017.10.27 12:00:25) into a number because I changed the function like follows below and now I have this weird graphic and the point in blue is the first value of my temperature and the respective date. If you have any suggestions other than "Date.parse()" to convert the date to a number I would appreciate.
[{"id":"280b51a9.1d20ee","type":"iot-datasource","z":"a287c70.b313638","name":"Temperature_historical_data","tstampField":"tstamp","dataField":"data","disableDiscover":false,"x":800,"y":420,"wires":[["d2f6ac7.9847f5"]]},{"id":"174ee565.e02b2b","type":"function","z":"a287c70.b313638","name":"Temp","func":"var p =msg.payload;\n\nfor(var i=0;i<p.length;i++){\n node.send({payload:{data:p[i].Temp, tstamp:p[i].Datum}});\n}\nreturn;","outputs":1,"noerr":0,"x":590,"y":420,"wires":[["280b51a9.1d20ee","5f0d558f.04310c"]]},{"id":"a74a3ded.a929e","type":"MSSQL","z":"a287c70.b313638","mssqlCN":"e1823c68.173aa","name":"database_sql","query":"","outField":"payload","x":430,"y":420,"wires":[["174ee565.e02b2b"]]},{"id":"542c5d2d.ed21e4","type":"inject","z":"a287c70.b313638","name":"","topic":"","payload":"SELECT * FROM [test].[Temp]","payloadType":"str","repeat":"","crontab":"","once":false,"onceDelay":0.1,"x":210,"y":420,"wires":[["a74a3ded.a929e"]]},{"id":"5f0d558f.04310c","type":"debug","z":"a287c70.b313638","name":"","active":true,"tosidebar":true,"console":false,"tostatus":false,"complete":"false","x":770,"y":340,"wires":},{"id":"d2f6ac7.9847f5","type":"debug","z":"a287c70.b313638","name":"","active":true,"tosidebar":true,"console":false,"tostatus":false,"complete":"false","x":1010,"y":340,"wires":},{"id":"e1823c68.173aa","type":"MSSQL-CN","z":"","name":"SQL","server":"localhost","encyption":true,"database":"test"}]