Hey together,
i got the issue that i got a chart with different temperatures. All data came in the same time, but i can only see one value on mouseover ...
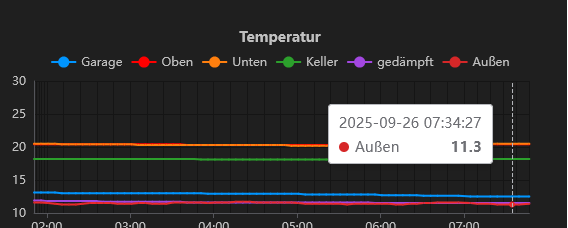
Anyone knows how to fix that ?
Regards,
Snot
Can you increase the point size on the chart so the samples can be seen? That may help to show what is happening.
If the messages arrive individually, they do not arrive at the same time no matter how close together they are. Even 1ms difference will create what you see (see chart 1 in demo below)
However, if you round the time to nearest reasonable value (e.g. to nearest 100ms) then you can align the time stamps (see chart 2).

This is the function I used to quantize the time
const now = Date.now()
const nowAlignedTo100ms = Math.round(now / 100) * 100
msg.payload = {x: nowAlignedTo100ms, y: msg.payload}
return msg
And you need to set the chart x/y options
That all said, there is an option in echarts to make the tooltip gather close_by values but that would be a future iteration (if requested in a FR issue)
he challenge here I believe would be multiple hits per line, or lines that are very offset would still catch
This is crazy complicated only to get the legend correct with all values ... even i choose hh:mm as factor to place data should be enough to get all values arrived in this timeslot (1 minute)
I believe that is only the visual representation, the mapped data are the source timestamps, if you align those you may have more success.
The tooltip is correct, your data is not ![]()
Thats not things work. (not saying is shouldn't/couldn't) as @bakman2 points out, the chart is visually representing exactly what you put in.
Copyright OpenJS Foundation and Node-RED contributors. All rights reserved. The OpenJS Foundation has registered trademarks and uses trademarks. For a list of trademarks of the OpenJS Foundation, please see our Trademark Policy and Trademark List. Trademarks and logos not indicated on the list of OpenJS Foundation trademarks are trademarks™ or registered® trademarks of their respective holders. Use of them does not imply any affiliation with or endorsement by them.
The OpenJS Foundation | Terms of Use | Privacy Policy | OpenJS Foundation Bylaws | Trademark Policy | Trademark List | Cookie Policy
