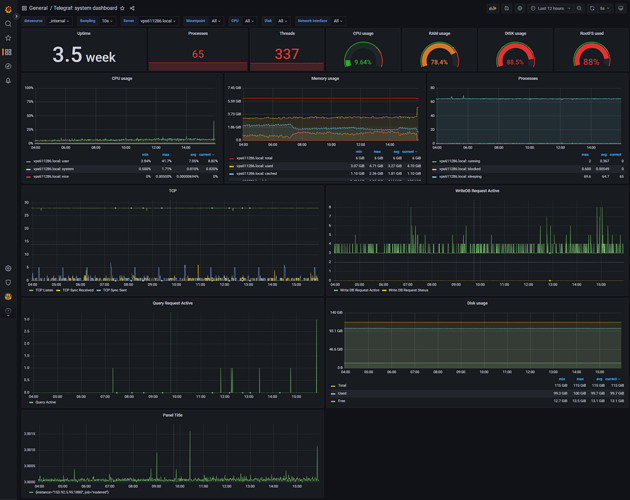
Hi guys, this might be quite uncommon question.
While we all using node red as a platform for monitoring other devices, but how to monitor the node red itself performance? Like the api request, memory or cpu usages and any others variable can be monitored.
Perhaps, the analogy quite the same like node red as SaaS as our own software deployed on a server as a service. We monitor the service usage and request per second and so on.
I found on a node red forum, we could use prometheus, but i tried it doesnt work well, it doesn't give all those parameters needed. (Pic)
Maybe some of you already tried it before, or maybe another performance monitoring for nodered itself
Thank you!
Feels like you are actually looking for 2 types of monitoring here. One is of your OS and hardware and the other is the msg throughput of specific node-red flows.
Really, node-red isn't the best tool to try and monitor itself, there are lots of complexities and you can easily end up influencing the results by running the monitor. Have a look at Telegram, InfluxDB and Grafana for general system monitoring. All free and relatively easy to set up.
For msg throughput, you will possibly get enough by measuring the flow in node-red and outputting to InfluxDB. Bring the monitors together in Grafana which is generally a lot more performant for complex timeseries charts than Dashboard.
There was another thread recent on outputs to InfluxDB where the OP hit a common performance issue - having 2 wires coming out of a node forces node-red to make a clone of the data which can be quite slow.. So watch out for that when doing monitoring.
Hi @TotallyInformation
sorry for the late reply
I think there is a misunderstanding about monitoring what I meant about.
i do want to focus on the node-red itself monitoring performance, as i said before for the cpu and others is the node-red usages not the whole server monitoring usages :'D
for now i have a monitoring system to monitor influxdb, but i dont have for the node red.
maybe you have experiences about this
pic 1 is the monitoring for my influxdb performance and server performance
Linux has all of that info, you just need to pull it out rather than using the overall summary data. Telegraf captures all of that for you as you see in this example:
hi thank you for the reply
i got it, i could use telegraf to get the specific cpu usage and memory, but how about monitoring api requests and infludb queries?
does linux provide that?
Telegraf provides monitoring for InfluxDB.
Monitoring API requests depends on what you want to monitor. Telegram can periodically do a request to a REST API endpoint and get back the performance details of the request.
It would probably also be possible to add telemetry to your nodes since Telegraf does have a template for node.js apps but I've no idea how easy that is to do.


