Hello. I have the same problem as described here, i.e. Grafana (locally installed on Linux) running on http instead of https, which leads to the message shown below. At the risk of answering my own question, does this mean I just need to follow these steps?

Yes. Or delegate HTTPS to a reverse proxy.
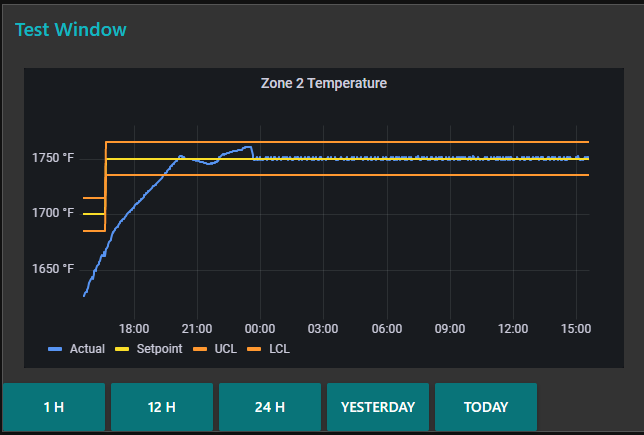
Just to tie up this thread, following the instructions above to set up Grafana make it so I can indeed view my Grafana chart as an iframe in Node-RED dashboard.