Hello All,
I wanted to show the data come from postgresql on nodered chart. My data is came from postgresql in below screenshot format so how I show this into chart? I want to show value on y-axis and date on x-axis. please help me.
The output is coming directly from postgres, no data changes were made ?
I would expect an array of data.
Hello @bakman2 . below is my flow. I convert postgres data into json using function node. please refer below flow. but if I give this function output to chart then nothing shown.
[
    {
        "id": "a8456abe9dc2476c",
        "type": "inject",
        "z": "48acf0a74b57fcc9",
        "name": "",
        "props": [
            {
                "p": "payload"
            },
            {
                "p": "topic",
                "vt": "str"
            }
        ],
        "repeat": "",
        "crontab": "",
        "once": false,
        "onceDelay": 0.1,
        "topic": "",
        "payload": "SELECT LAST_VALUE (\"aqs1_eco2\") over(order by \"aqs1_datetime\" desc) y,\"aqs1_datetime\" x FROM \"air_quality\" where \"aqs1_eco2\" !='NaN' limit 10",
        "payloadType": "str",
        "x": 150,
        "y": 740,
        "wires": [
            [
                "92b824a670efeb1d"
            ]
        ]
    },
    {
        "id": "be6125e12a05d6b3",
        "type": "debug",
        "z": "48acf0a74b57fcc9",
        "name": "debug 14",
        "active": true,
        "tosidebar": true,
        "console": false,
        "tostatus": false,
        "complete": "false",
        "statusVal": "",
        "statusType": "auto",
        "x": 760,
        "y": 740,
        "wires": []
    },
    {
        "id": "92b824a670efeb1d",
        "type": "postgres",
        "z": "48acf0a74b57fcc9",
        "postgresdb": "d91d328a1cfd9505",
        "name": "",
        "output": true,
        "perrow": false,
        "rowspermsg": "1",
        "return_on_error": false,
        "limit_queries": "0",
        "limit_by": "payload",
        "limit_value": "1",
        "limit_drop_intermediate": false,
        "limit_drop_if_in_queue": false,
        "outputs": true,
        "x": 380,
        "y": 720,
        "wires": [
            [
                "fcd97642c5882615"
            ]
        ]
    },
    {
        "id": "fcd97642c5882615",
        "type": "function",
        "z": "48acf0a74b57fcc9",
        "name": "function 47",
        "func": "var arr = msg.payload; // get the array\nvar rv = {};// create a new empty object\nfor (var i = 0; i < arr.length; ++i) {\n    let key = (i + 1); //built a key \n    rv[key] = arr[i]; // set value in New object\n}\nmsg.payload = [{\n    \"series\": [\"A\"],\n    \"data\": [rv],\n    \"labels\": [\"\"]\n}]\n\nreturn msg;",
        "outputs": 1,
        "noerr": 0,
        "initialize": "",
        "finalize": "",
        "libs": [],
        "x": 570,
        "y": 720,
        "wires": [
            [
                "be6125e12a05d6b3",
                "d8c79b20b887df16"
            ]
        ]
    },
    {
        "id": "d91d328a1cfd9505",
        "type": "postgresdb",
        "cfgname": "",
        "hostname": "localhost",
        "port": "5432",
        "db": "postgres",
        "ssl": false
    }
]
In the function node you are creating a new object (why ?) while the chart expects an array.
yess but when i directly connect postgresql output to chart then also nothing happens. can you tell me in which format we have to modify the array which is got from postgresql node.
See the chart documentation.
Your query looks a little off
SELECT LAST_VALUE ("aqs1_eco2") over(order by "aqs1_datetime" desc) y,"aqs1_datetime" x FROM "air_quality" where "aqs1_eco2" !='NaN' limit 10
You may want to add AS to it. e.g.
SELECT LAST_VALUE ("aqs1_eco2") over(order by "aqs1_datetime" desc) AS y,"aqs1_datetime" AS x FROM "air_quality" where "aqs1_eco2" !='NaN' limit 10
Then your returned array should have the correct property names, and you should be able to use it in your function to create the chart array
e.g.
msg.payload = [{
    "series": ["A"],
    "data": [msg.payload],
    "labels": [""]
}]

return msg;
Hey @E1cid but without using AS query work properly. there is no issue in query but I want array format for chart
Yes and as said if you add AS the returned array payload should look like.
[{"x":"2022-12-12T12:12:12.0000Z","y":6},{"x":"2022-12-13T12:12:12.0000Z","y":8}]
With correct property names "x" and "y"
yes. but when I pass this to chart node it not shown any value.
Yes, but did you format it as the function example i gave?
yes I tried this but no output shown.
Show us, supply a copyable output of the db node and the function node. And the contents of your function node.
Yes sure.
- DB node output
[{"x":"2022-12-23T11:11:10.855Z","y":656},{"x":"2022-12-23T05:26:12.655Z","y":476.0774},{"x":"2022-12-23T05:26:10.579Z","y":464.13437},{"x":"2022-12-23T05:26:08.491Z","y":480.3768},{"x":"2022-12-23T05:26:06.426Z","y":479.91278},{"x":"2022-12-23T05:26:04.345Z","y":491.01263},{"x":"2022-12-23T05:26:02.162Z","y":487.83685},{"x":"2022-12-23T05:26:00.057Z","y":475.14542},{"x":"2022-12-23T04:34:32.020Z","y":479.7275},{"x":"2022-12-23T04:34:29.833Z","y":477.61743}]
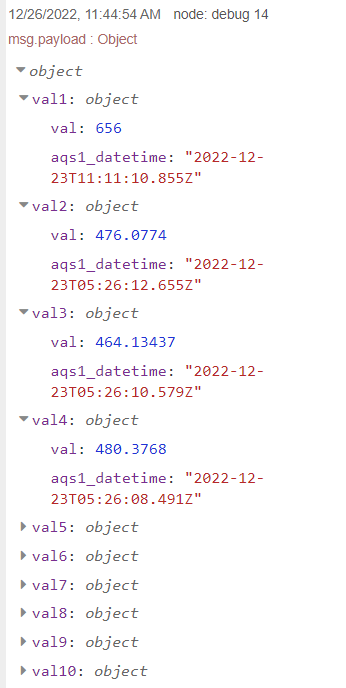
- function node output
[{"series":["A"],"data":[{"1":{"x":"2022-12-23T11:11:10.855Z","y":656},"2":{"x":"2022-12-23T05:26:12.655Z","y":476.0774},"3":{"x":"2022-12-23T05:26:10.579Z","y":464.13437},"4":{"x":"2022-12-23T05:26:08.491Z","y":480.3768},"5":{"x":"2022-12-23T05:26:06.426Z","y":479.91278},"6":{"x":"2022-12-23T05:26:04.345Z","y":491.01263},"7":{"x":"2022-12-23T05:26:02.162Z","y":487.83685},"8":{"x":"2022-12-23T05:26:00.057Z","y":475.14542},"9":{"x":"2022-12-23T04:34:32.020Z","y":479.7275},"10":{"x":"2022-12-23T04:34:29.833Z","y":477.61743}}],"labels":[""]}]
- content of function node.
var arr = msg.payload; // get the array
var rv = {};// create a new empty object
for (var i = 0; i < arr.length; ++i) {
    let key = (i + 1); //built a key
    rv[key] = arr[i]; // set value in New object
}
msg.payload = [{
    "series": ["A"],
    "data": [rv],
    "labels": [""]
}]

return msg;
please tell me anything required.
I do not see my example function code, but you said you tried it.
Delete your function code and add my example which you said you tried but obviously you did not.
I tried with your function also. I thought you want my function that's why I send you this.
Then show us the output of the function using my example.
Yes sure. This flow is with your function but no output shown
[
    {
        "id": "a8456abe9dc2476c",
        "type": "inject",
        "z": "48acf0a74b57fcc9",
        "name": "",
        "props": [
            {
                "p": "payload"
            },
            {
                "p": "topic",
                "vt": "str"
            }
        ],
        "repeat": "",
        "crontab": "",
        "once": false,
        "onceDelay": 0.1,
        "topic": "",
        "payload": "SELECT \"aqs1_datetime\" x, LAST_VALUE (\"aqs1_eco2\") over(order by \"aqs1_datetime\" desc) y FROM \"air_quality\" where \"aqs1_eco2\" !='NaN' limit 10",
        "payloadType": "str",
        "x": 230,
        "y": 760,
        "wires": [
            [
                "92b824a670efeb1d"
            ]
        ]
    },
    {
        "id": "d8c79b20b887df16",
        "type": "ui_chart",
        "z": "48acf0a74b57fcc9",
        "name": "",
        "group": "7563cc51495d2ace",
        "order": 26,
        "width": 22,
        "height": 7,
        "label": "chart",
        "chartType": "line",
        "legend": "false",
        "xformat": "HH:mm:ss",
        "interpolate": "linear",
        "nodata": "",
        "dot": false,
        "ymin": "",
        "ymax": "",
        "removeOlder": 1,
        "removeOlderPoints": "",
        "removeOlderUnit": "3600",
        "cutout": 0,
        "useOneColor": false,
        "useUTC": false,
        "colors": [
            "#1f77b4",
            "#aec7e8",
            "#ff7f0e",
            "#2ca02c",
            "#98df8a",
            "#d62728",
            "#ff9896",
            "#9467bd",
            "#c5b0d5"
        ],
        "outputs": 1,
        "useDifferentColor": false,
        "className": "",
        "x": 830,
        "y": 760,
        "wires": [
            []
        ]
    },
    {
        "id": "92b824a670efeb1d",
        "type": "postgres",
        "z": "48acf0a74b57fcc9",
        "postgresdb": "d91d328a1cfd9505",
        "name": "",
        "output": true,
        "perrow": false,
        "rowspermsg": "1",
        "return_on_error": false,
        "limit_queries": "0",
        "limit_by": "payload",
        "limit_value": "1",
        "limit_drop_intermediate": false,
        "limit_drop_if_in_queue": false,
        "outputs": true,
        "x": 400,
        "y": 760,
        "wires": [
            [
                "32d8ed955c608ebd"
            ]
        ]
    },
    {
        "id": "32d8ed955c608ebd",
        "type": "function",
        "z": "48acf0a74b57fcc9",
        "name": "function 51",
        "func": "msg.payload = [{\n    \"series\": [\"A\"],\n    \"data\": [msg.payload],\n    \"labels\": [\"\"]\n}]\nreturn msg;",
        "outputs": 1,
        "noerr": 0,
        "initialize": "",
        "finalize": "",
        "libs": [],
        "x": 590,
        "y": 760,
        "wires": [
            [
                "d8c79b20b887df16",
                "be6125e12a05d6b3"
            ]
        ]
    },
    {
        "id": "be6125e12a05d6b3",
        "type": "debug",
        "z": "48acf0a74b57fcc9",
        "name": "debug 14",
        "active": true,
        "tosidebar": true,
        "console": false,
        "tostatus": false,
        "complete": "false",
        "statusVal": "",
        "statusType": "auto",
        "x": 780,
        "y": 700,
        "wires": []
    },
    {
        "id": "7563cc51495d2ace",
        "type": "ui_group",
        "name": "Group 1",
        "tab": "2c345b679207408c",
        "order": 1,
        "disp": false,
        "width": "26",
        "collapse": false,
        "className": ""
    },
    {
        "id": "d91d328a1cfd9505",
        "type": "postgresdb",
        "cfgname": "",
        "hostname": "localhost",
        "port": "5432",
        "db": "postgres",
        "ssl": false
    },
    {
        "id": "2c345b679207408c",
        "type": "ui_tab",
        "name": "test",
        "icon": "dashboard",
        "order": 1,
        "disabled": false,
        "hidden": false
    }
]
[edit] I see no output from the function node, which i asked to see.
Works for me with simulated db return
[{"id":"4479f8255f9f6a76","type":"inject","z":"da8a6ef0b3c9a5c8","name":"","props":[{"p":"payload"},{"p":"topic","vt":"str"}],"repeat":"","crontab":"","once":false,"onceDelay":0.1,"topic":"","payload":"SELECT \"aqs1_datetime\" x, LAST_VALUE (\"aqs1_eco2\") over(order by \"aqs1_datetime\" desc) y FROM \"air_quality\" where \"aqs1_eco2\" !='NaN' limit 10","payloadType":"str","x":310,"y":1120,"wires":[["f62ef5ded5eab12c"]]},{"id":"f62ef5ded5eab12c","type":"change","z":"da8a6ef0b3c9a5c8","name":"","rules":[{"t":"set","p":"payload","pt":"msg","to":"[{\"x\":\"2022-12-23T11:11:10.855Z\",\"y\":656},{\"x\":\"2022-12-23T05:26:12.655Z\",\"y\":476.0774},{\"x\":\"2022-12-23T05:26:10.579Z\",\"y\":464.13437},{\"x\":\"2022-12-23T05:26:08.491Z\",\"y\":480.3768},{\"x\":\"2022-12-23T05:26:06.426Z\",\"y\":479.91278},{\"x\":\"2022-12-23T05:26:04.345Z\",\"y\":491.01263},{\"x\":\"2022-12-23T05:26:02.162Z\",\"y\":487.83685},{\"x\":\"2022-12-23T05:26:00.057Z\",\"y\":475.14542},{\"x\":\"2022-12-23T04:34:32.020Z\",\"y\":479.7275},{\"x\":\"2022-12-23T04:34:29.833Z\",\"y\":477.61743}]","tot":"json"}],"action":"","property":"","from":"","to":"","reg":false,"x":480,"y":1100,"wires":[["de564af715f02fcb"]]},{"id":"de564af715f02fcb","type":"function","z":"da8a6ef0b3c9a5c8","name":"function 51","func":"msg.payload = [{\n \"series\": [\"A\"],\n \"data\": [msg.payload],\n \"labels\": [\"\"]\n}]\nreturn msg;","outputs":1,"noerr":0,"initialize":"","finalize":"","libs":[],"x":670,"y":1100,"wires":[["01df3f76109cb28e","2003c7cc0b6186d4"]]},{"id":"01df3f76109cb28e","type":"ui_chart","z":"da8a6ef0b3c9a5c8","name":"","group":"8adcc559c27febcf","order":26,"width":22,"height":7,"label":"chart","chartType":"line","legend":"false","xformat":"HH:mm:ss","interpolate":"linear","nodata":"","dot":false,"ymin":"","ymax":"","removeOlder":1,"removeOlderPoints":"","removeOlderUnit":"3600","cutout":0,"useOneColor":false,"useUTC":false,"colors":["#1f77b4","#aec7e8","#ff7f0e","#2ca02c","#98df8a","#d62728","#ff9896","#9467bd","#c5b0d5"],"outputs":1,"useDifferentColor":false,"className":"","x":910,"y":1100,"wires":[[]]},{"id":"2003c7cc0b6186d4","type":"debug","z":"da8a6ef0b3c9a5c8","name":"debug 14","active":true,"tosidebar":true,"console":false,"tostatus":false,"complete":"false","statusVal":"","statusType":"auto","x":860,"y":1040,"wires":[]},{"id":"8adcc559c27febcf","type":"ui_group","name":"Group 1","tab":"80b11933687c9cc6","order":1,"disp":false,"width":"26","collapse":false,"className":""},{"id":"80b11933687c9cc6","type":"ui_tab","name":"test","icon":"dashboard","order":1,"disabled":false,"hidden":false}]

yeaahhhhhhh. Now its also worked for me. I have one syntax error that missing ']' thats why not shown out. Thank you so muchhhh. But one more thing please help me that. I want to show date and time in chart. it shows only time