Hello,
First project using Node Red. It is used to speak to a fiber optic transceiver.
On one dashboard page I have 6 ui-charts configured in line mode to show the last n time period. I've tried 5 minutes and 90 seconds.
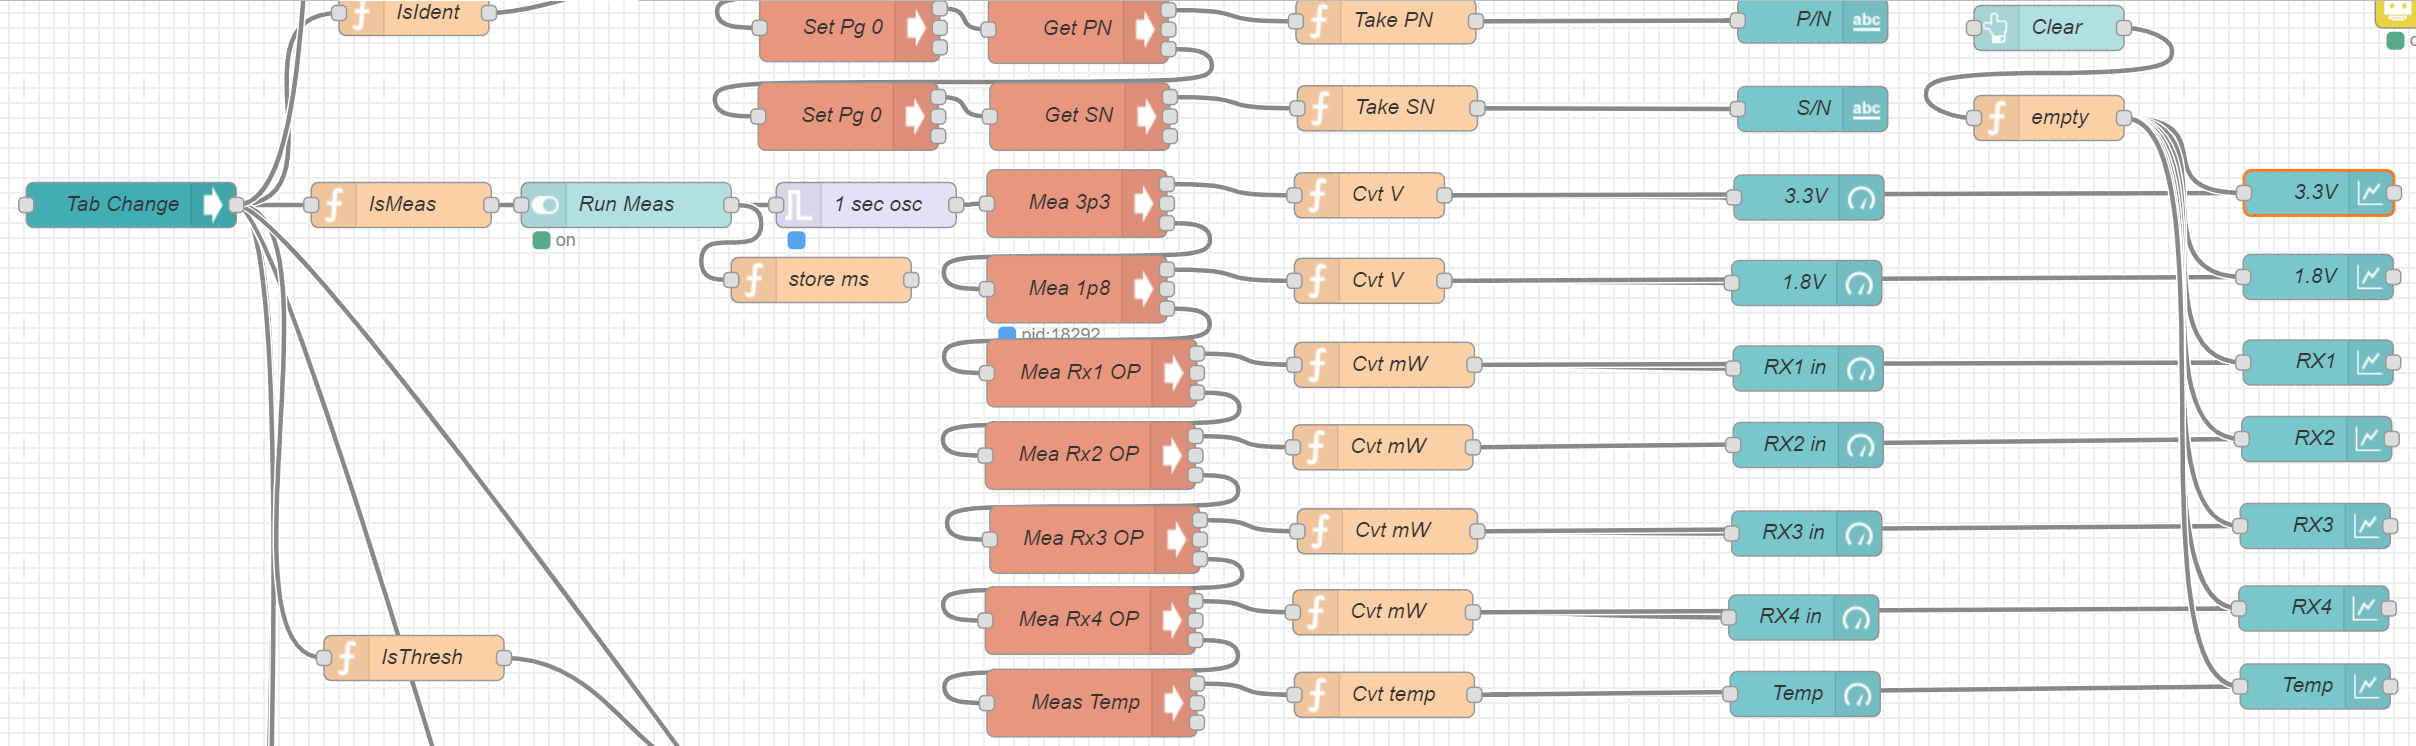
The main loop code, when this page is visible, performs the following based on a 1 second timestamp:
Read a set of 6 registers using the exec function.
Convert the register contents to appropriate messages: msg.payload is value, msg.timestamp is Date.now();
Send the messages to gauge and ui-chart pairs.
For the first few minutes, the charts collect and display the data properly. When the history time has been achieved, the charts begin scrolling.
After some time, which is different for each chart, the chart will jump to a vertical line or blob on the left hand side. The X axis appears to stop updating. I don't see any oddities in the message streams. The Y axis remains properly scaled.
It is consistent in that it fails. It is inconsistent in the time it takes to fail.
The failures occur with no user activity on the host PC and I appear to have slack time in my 1 second operating period. I've tried longer times, thinking the process was running out of time, but it makes no difference in the failure.
Task manager / resource monitor shows the PC is consuming a fair percentage of the CPU resources at the time of the failure. This leads me to believe the PC may not be processing something in time.
I am under NDA on the optical transceiver, so I don't believe I can share the flow as it contains information proprietary to the party we hold that NDA with.
I have attached three pics: One of the dashboard operating properly, one with the failure and one showing the relevant portion of the flow. Sorry, no code for the functions.


I am running an Octavo-Red platform with Debian 9.9 and Node Red 19.6. I don't know which version of dashboard I'm running, but I installed it from within the Node Red program on 5 Sep, 2019.
My windows PC is a Dell Precision 7100 laptop, Xeon and 32G RAM, using Windows 10 Pro kept up to date with all updates as they are released. I have Achronix, malwarebytes and Bit defender installed for virus / malware protection. I'm using Chrome for my browser, but the failure is the same when I use Edge.
Since I can't share code, I'm simply submitting this as a bug report. If it is duplicated on your end, and a solution is found, I will be happy to implement.
Regards,
Johnsonl