Set it as 'Categorical' Only use 'Timescale' if your x axis is in epoch times (Timestamps must be in milliseconds (ms)).
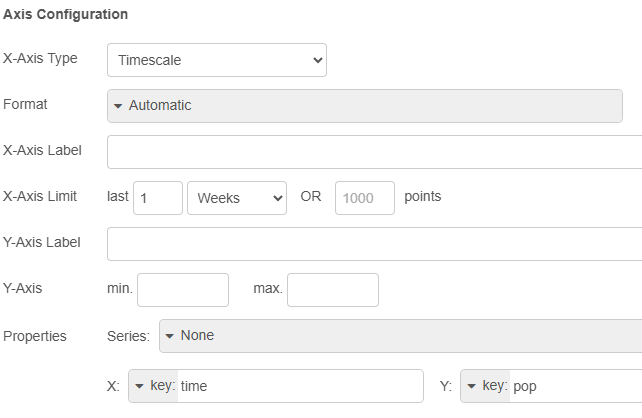
X-Axis Type: Choose between a "Timescale" (for time-based data), "Linear" (for numerical data), or "Categorical" (for non-numeric data). You'll notice that some x-axis types are only available for certain chart types.
Note if you send timestamps and set X Axis Type to 'Timescale' you can then show it in various formats as defined by the Format field
HH:mm:ss | HH:mm | YYYY-MM-DD | DD/MM | dd HH:mm | Custom | Auto Defines how the values are displayed on the axis, when X-Axis type is 'timescale'. See here for an overview of all available Luxon tokens.
@Buckskin … thanks for verifying my understanding. Concerning the x-axis timestamp, if I want to format the field would I include something like this in payload: ui_control: { "xformat": "HH:MM" }
It seems that you cannot have 'categorical' x axis for a line chart, only timestamp or linear, unlike the old dashboard with did support this. See also Flowfuse Dashboard line chart using categorical x axis values, which I am hoping someone will produce an answer for.
@Colin … well that explains the problem I’m having with my 2nd chart where I’m using the day of the week (i.e., Mon, Tue, Wed) as the x-axis value but it is not displaying them.