Hey together,
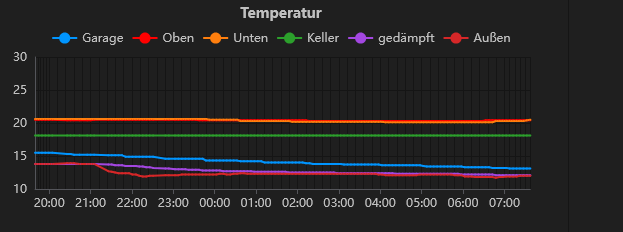
the closeest value in a chart is 10, if there was a value of 20.1 the legend goes up to 30. How could i make a closer resolve of the chart to the next 5 or 3 instead of 10 ? This makes small charts very ... unlucky.
Regards,
Snot
There is an open issue with a suggestion to allow the min and max sample values to specify the range directly, and potentially to provide an improved algorithm for the scaling.
You might like to add a comment there.
Copyright OpenJS Foundation and Node-RED contributors. All rights reserved. The OpenJS Foundation has registered trademarks and uses trademarks. For a list of trademarks of the OpenJS Foundation, please see our Trademark Policy and Trademark List. Trademarks and logos not indicated on the list of OpenJS Foundation trademarks are trademarks™ or registered® trademarks of their respective holders. Use of them does not imply any affiliation with or endorsement by them.
The OpenJS Foundation | Terms of Use | Privacy Policy | OpenJS Foundation Bylaws | Trademark Policy | Trademark List | Cookie Policy