Here is my complete message debug payload results:
solarmd/energy/outputEnergy/bank1 : msg.payload : Object
object
sniu: false
serialNumber: null
deviceID: null
lastUpdate: 1677215035885
voltageV: 53.284
currentA: 16.17
powerW: 861.14952
capacityP: 85.71486689814814
capacityAh: 123.42940833333333
ratedCapacityAh: 144
ratedVoltageV: 51.2
ratedChargeCurrentC: 0.6940000000000001
ratedDischargeCurrentC: 0.6940000000000001
storageName: "bank1"
remainingTimeSign: 4972
dcConnected: true
available: true
dcConnectedDevice: 1
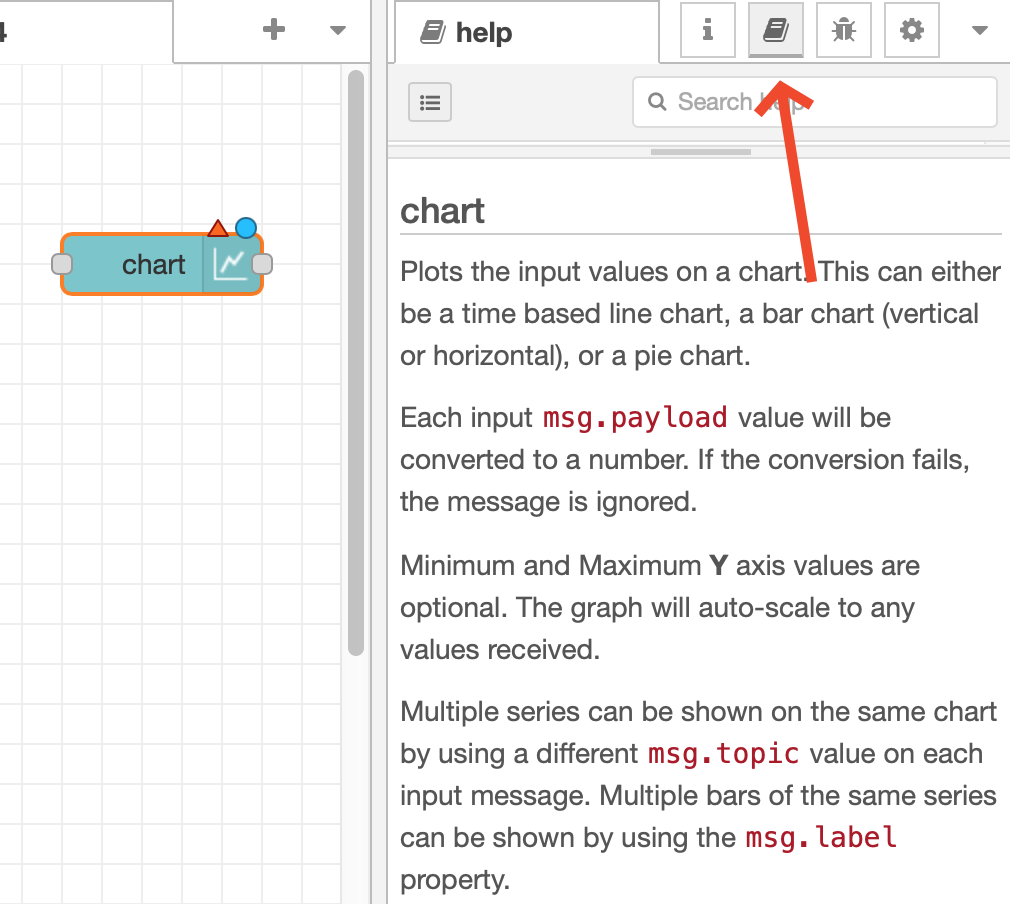
I am trying to use this chart mode:

to achieve a graph similar to this graph to depict battery levels

Setting the parameters for the graph I think I can do but I am unable to isolate
msg.payload.capacityP
from the payload.
I will appreciate any pointers / help very much.