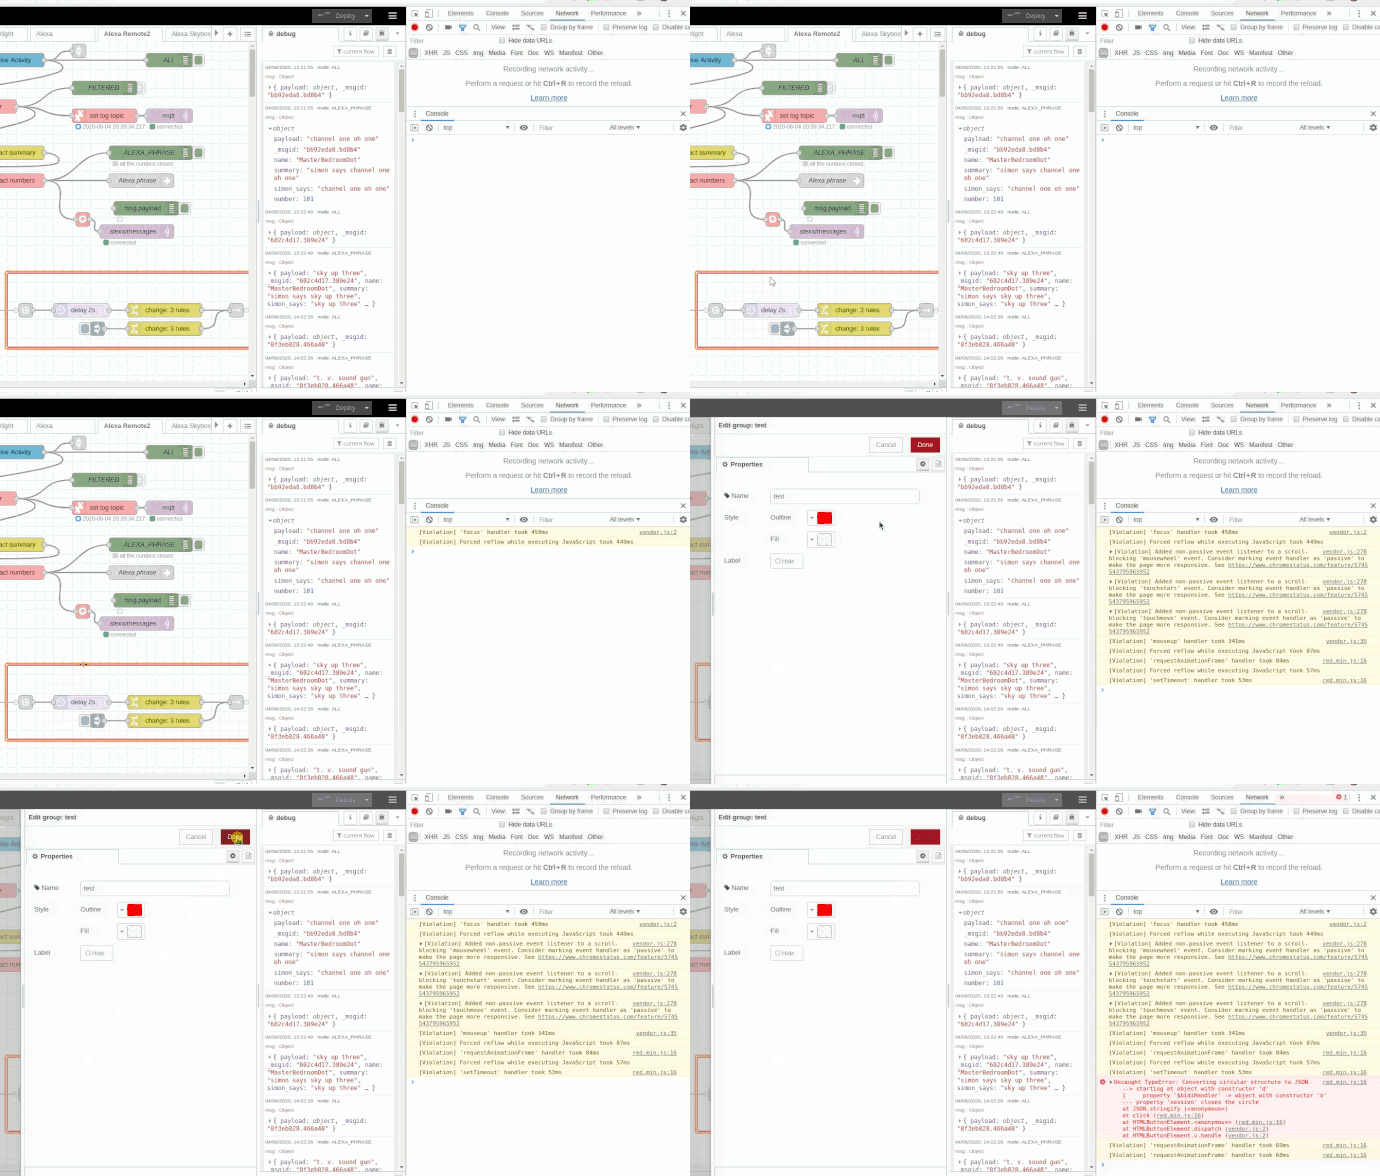
Please check the browser JavaScript console for any errors.
Weird, I refreshed the page and now it's working fine!
sounds like a classic browser cache problem?
Something occurred to me this afternoon that I wanted to get some quick feedback on - particular from those of you now trying out the beta.
The Outliner in the Info sidebar could, with a couple more tweaks, make the Configuration Nodes sidebar redundant.
What do you think? Please have a read of the issue I link to above and add a comment.
For me the Configuration Nodes sidebar has only one usage - delete unused stuff. And the thing is missing here is the option to delete unused stuff with one click.
Just a thought, also have the possibility to select nodes from the outliner, move it to the left pane and just use the right pane for debugging.

I think merging the configuration nodes sidebar into the outliner sidebar is a very good idea.
What exactly is meant with the filter option? That you have to type in is:unused?
Maybe just another line which you could expand that shows the unused ones?
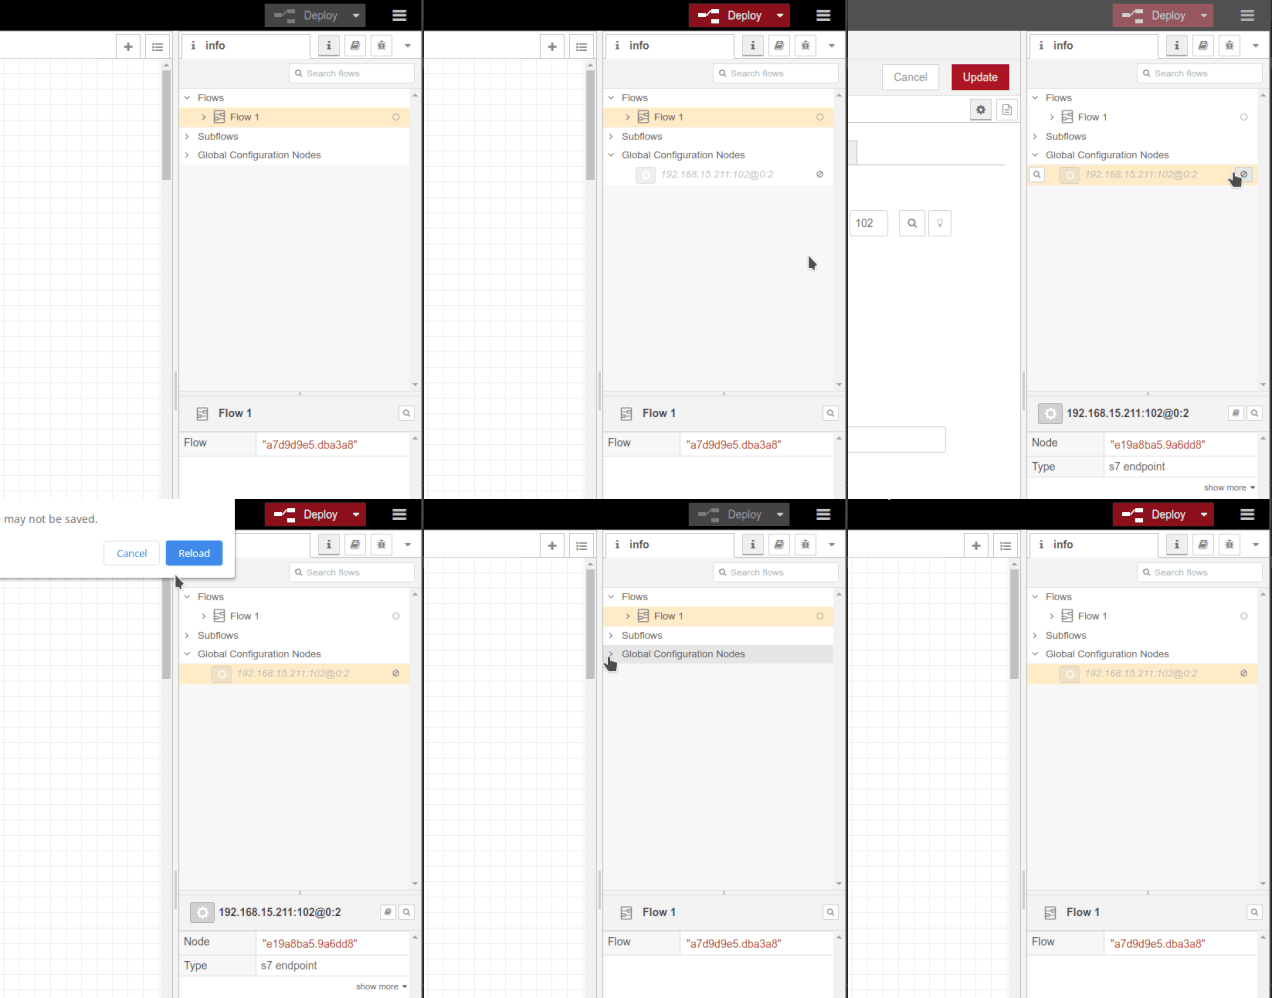
By the way, is it only me, or if you disable a config node from the outliner sidebar, you cannot enable it again without reloading the editor browser window/tab? For normal nodes that works.
And is such a great feature 
@cymplecy need a bit more context... when does that error happen?
Couple of small issues, non-critical. After loading the new version, clearing cache and reloading the editor:
-
Double click on an http-request node then cancelling by clicking outside the config panel marks the node as changed and needing redeploy. Doesn't happen if you press cancel in the config panel. Also happens with the some other nodes (I didn't test every node type):
- http-request
- inject
- debug
- function
- uibuilder
- ui_template
- ui_button
- ui_notification
Issue does not repeat after a deploy for those nodes that were marked but does happen on nodes not yet refreshed.
-
Odd visual effect on a tab with my prototype Gun.js node. Opening the config panel for any of the Gun nodes turns the node's icon to blue foreground colour. Once that has happened, opening other config panels for non-Gun nodes changes the colour of a "random" Gun node on the same tab. Doesn't happen after reloading the page until a Gun node has been edited again. Can't see this happening with other nodes. The tab is the last one in the editor in case that makes a difference. Issue continues after a deploy.

Here is a gif that illustrates both issues:
UPDATE: Seen similar issue happening with uibuilder, editing the config turned the icon of a comment node just above it blue.
- On first deploy after testing the above, I get a warning about multiple nodes not being properly configured:

Only error I can see in the browser console is: Unknown type: swagger-doc from red.js:25658, no errors in the Node-RED console log.
Interestingly, not all Dashboard nodes are marked as invalid:
Looks like the Group setting is what is causing the issue - yep, every Dashboard node that has a group setting. Updating the group fixes the issue.
Updating the Group left ui_tab config nodes orphaned. This only happened after updating the group above. The ui_tab config nodes are marked as having no uses even though they clearly are:
I see that too.
There is an uncaught error in red.js at line 27666 (appropriate!)
if (JSON.stringify(oldValues[d]) !== JSON.stringify(editing_node[d])) {
    changes[d] = oldValues[d];
    changed = true;
}
JSON.stringify is never safe to be called without being wrapped in a try/catch.
There's also an issue regarding en/disabling configuration nodes in the new Outliner, where it works once, but then doesn't anymore until a refresh
Already opened [an issue] on GitHub, mentioning it here just in case somebody also finds it out and don't find the issue there
I know that felling all too well.
Already reported in this thread and fix : 🎉 Node-RED 1.1.0-beta.1 released - #17 by knolleary
Already mentioned in the thread and on my list of things to fix.
Bear with me;
Outliner
[bug] Global Configuration Nodes: Can disable once, deploy. Try to enable, button no longer responds and remains disabled. Refresh browser window and it can be enabled again.
[request] When hovering the enable/disable button, missing tooltip (had to guess what the button does), same applies to the "play" button.
[request] When searching for a node, node is highlighted in workspace, highlight/select in the outliner as well
[suggestion] Outliner node order is currently done based on order it was added to workspace. Would be nice to have some (consistent) order (example; inject/input nodes at the top/debug nodes at the bottom )
[suggestion] I like the outliner a lot, but would A) prefer to see both the outliner+debug at the same time (configurable ?) or B) expand the node info window to show all properties directly, currently the node properties panel does not add much value anymore imho
Nodes
[request] Settings option to set debug node to 'complete msg object' by default
Keyboard shortcuts
[suggestion] Trying to add shortcut for hiding node labels. Enter cmd+shift+ctrl+a click verify icon ends up 'unassigned'. '+' is not a correct character, but not validated incorrectly (meaning no red border shown). I understand to use '-' between the keys but it is not clear how to set shortcuts up.
[suggestion] I feel that show/hide node labels should be a "toggle" instead of 2 different shortcuts.
Node Help Section
[suggestion] Add a header for related examples, eg 'Examples', lists the available examples for the node, clicking 1 of them would open the import dialog with the examples with the related node examples expanded. Flow examples are too hidden, while people do put effort in to create them, more visibility could improve user experience.
Trigger node
[bug] check "send second message to separate output", deploy. Disabling the checkbox again does not enable deploy button.
Http request node
[suggestion] New HEAD option and GET option(s) - documentation update
Weird glitch - can repeat this
Happens when exiting editing a node and then selecting another loose node (doesn't happen with nodes already connected)
NR on Win10 - browser Chromium on Pi4
Thanks all for the feedback. I've edited the post to include a list of known issues and their status.
Please check against that before reporting anything else.
I can't see that in your OP
My report on duplicate debug log messages on Android was left out. I was able to pinpoint the issue to actually be duplicate inject node manual trigger on a single tap. Perhaps both touchstart and onclick events fire?
On a related note, I've noticed now with 1.1 the edit dialogs open on a single tap instead of long press -> edit. This might actually be an improvement after getting used to it, whether intentional or unintentional (didn't spot or missed this from the change list).


