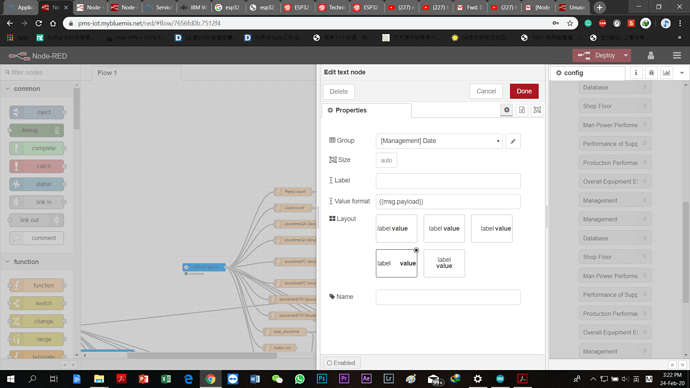
Hi, I am doing a project about Real-time Production Monitoring System via IoT Platform. I use an ESP32 to connect it on the IBM cloud and NodeRed. My NodeRed flow is not working on the dashboard and after I deploy my flow, it shows some unused nodes which I think they are not installed. The unused nodes shown are under ui_group and ui_tab. I am not sure what is happening on the NodeRed, please advice !
Don't worry about the unused nodes for now.
Let's see if we can get the dashboard working.
What happens when you click on the dashboard button (top right button that looks like a bar graph)?
When you click on that, the line below changes and on the right side you get a box with an arrow coming out of the top right corner icon.
Click on that and that will open a new browser page with the dashboard.
Are there any things visible?
Nope. It shows a blank page
Oh.
Ok, don't panic.
Sorry, I'm not that well versed on what to do now.
(again) Don't panic.
I hope someone else who is better at that will reply and help you.
In which ui-group/tab is the text-node sitting ?
Also start node red in a terminal and post the log here please.
And in which tab ? (click the pen)
Where do all these other ui_groups come from
Did you click deploy ?
Yes, I am trying to adjust back the group and tab in the text-node.


