Why are the contents of files deleted?

I would use the syntax shown in the link I posted, you don't need to tell it where to save it, it defaults to the subdirectory context under the folder where the node-red flow is stored.

contextStorage: {
   default: "memoryOnly",
   memoryOnly: { module: 'memory' },
   file: { module: 'localfilesystem' }
},

and when you want the context to be persistent then specify "file" in the code for the context store.

No.

I don't understand the question. You won't be writing a file, instead you will use something like flow.set("chart_data", thedata, "file")
and to restore it use flow.get


For the "write File" node that I use, I have to specify a path.

flow.set("chart_data", thedata, "file")
Where should I write this?

As I said, if you are using persistent context then you won't use the file nodes at all. Node-red will automatically save the context data to file.

I think you need to read the docs on using context again. What is your native language? Perhaps there is someone here who can help in your language.

contextStorage: {
   default: "memoryOnly",
   memoryOnly: { module: 'memory' },
   file: { module: 'localfilesystem' }
},

So I only have to set this in settings.js and do nothing else?

I could read the documentation 100 more times without the knowledge I have now and I wouldn't get any further. Just finding the settings.js was difficult, because nobody wrote down that it can be found in /data. How is a beginner supposed to know that?

German is my language.

Set the default to file so you won't have to name it when you do a save.

Here is something I wrote (quite awhile ago) that you may find informative

You also have to remove the file save and file restore and save the data to context instead.

Have you watched the introductory videos? Node-RED Essentials. The videos are done by the developers of node-red. They're nice & short and to the point.

Also have a look at @zenofmud's post and see if that helps.

You need to understand the basic concepts of using context. If you still don't then ask specific questions about the bits of the docs that you do not understand.

Bildschirmfoto_2023-12-18_19-03-02

So, what would be the correct way around so that the data is saved and always displayed in the chart?

And what does "deep copy value" mean?

or does flow. have something to do with the name of the flow?

ok i have now found the right order for me to save the data i need for the chart.
However, I have the problem that it uses a completely different directory and not the one specified in the documentation in ~/.node-red/context/.

/data/context/aaf05c55e0b0b331/flow.json
is the directory and the file in which it saves the data...
And specifying which directory it should use is also useless.
Anyone have a tip as to why this could be?

However, I don't know how to restore the data if it disappears from the chart.
So far I have not found a way how or where I can enter data such as:
flow.set("partid", "b301", "storeInFile");
could be entered.

By the way, I can't find this flow.get from the video Working with Context - Node-RED Essentials either. With the change node I only have set, change, delet, move. So unfortunately the 3 year old video doesn't help either because apparently a lot has changed?

I don't know if you have noticed, I have already sent several pictures, but I only have a GUI and input masks, but nothing that resembles a console and where I could see and edit things like "flow.set("partid", "b301", "storeInFile");". So is there some kind of console where you can see and edit these things?

so again concrete questions:

  1. how do I get Node Red to save the chart data in the ~/.node-red/context/ directory?
  2. how do I get Node Red to save the chart data in individual files?
  3. how do I get the 'flow.get' if there are only set, change, delete and move in the change node?
  4. how do I restore the data if the chart is emptied?
  5. is there a kind of console where you can see the nodes as text like here for example: flow.set("partid", "b301", "storeInFile"); ?

This is javascript code and you use it in a function node.
The original code you posted, though I could not import it to look at, does contain a function node.

Double click on the node and an editor window should popup. This is an example on my PC

Look at the options:

OK ich glaube hier hat keiner Lust mir zu helfen.
Ja sry das mein Englisch nicht so gut ist und ich deshalb die Dokumentation mal null verstehe und nein wie sollen Englische Videos helfen...

Ich will doch einfach nur das die Daten die per mag kommen und in einer Grafik angezeigt werden, gespeichert werden und wenn der Container Mal neu startet, ich sie wiederherstellen kann.

Diese ganze context hier, flow.set flow.get da hilft mir nicht.

Kann mir nicht jemand ohne "Um den heißen Brei zu reden" mal klipp und klar sagen, was ich dafür brauche und wo ich das einstellen muss?

Es werden Zahlen gesendet, das sind Temperaturen, die werden in die Grafik gespeist, damit man es besser sieht. Diese Daten aus der Grafik mit Zeitstempel möchte ich speichern damit ich sie wiederherstellen kann, falls die Grafik die Daten durch einen Neustart verliert.
Welche Einstellungen brauche ich dafür?
Welche Nodes brauche ich dafür?
Was muss ich bei den Nodes einstellen?

PS: But thank you, now I know how a beginner who has no idea about the subject feels. You just feel shitty and left alone -.-

Regrettably I speak no German at all, but automatic translation seems to suggest that you are in despair.

Please edit your first post. Make the code importable by putting three back ticks like this on the line above the Node-red code and the line below it.
image

Also show us a sample of your /home/chart.log file please.

Late to the party but... This "old" example flow still works - you need to set the location of the file you want to save and reload from (currently set to /tmp/ which is a linux thing - and in memory :slight_smile: so wouldn't survive a power failure - but can be anywhere you are allowed to write to)... and doesn't use context at all :wink:

The downside of this approach is that it does write/rewrite the file every time it gets new data - so it not really suitable for fast moving data - but should be ok for temperatures hopefully.

https://flows.nodered.org/flow/92920b4fd450bf92a3035e061947daa0

If you want it to be totally automatic - then connect the output of the top json node direct to the file node instead. and then add a ui-control node and connect it to the read file node... that way every write will get saved, and likewise every time the page reloads it will get re-read - e.g.

[{"id":"4679091.0341ff8","type":"ui_button","z":"1cf395c5f3a1c332","name":"","group":"212b7f06.b4731","order":2,"width":"2","height":"1","label":"Inject","color":"","bgcolor":"","icon":"","payload":"","payloadType":"str","topic":"","x":150,"y":340,"wires":[["63911393.d1513c"]]},{"id":"63911393.d1513c","type":"random","z":"1cf395c5f3a1c332","name":"","low":"0","high":"10","inte":"true","x":320,"y":340,"wires":[["9e4c2fd0.aac16"]]},{"id":"9e4c2fd0.aac16","type":"ui_chart","z":"1cf395c5f3a1c332","name":"","group":"212b7f06.b4731","order":1,"width":0,"height":0,"label":"chart","chartType":"line","legend":"false","xformat":"HH:mm:ss","interpolate":"bezier","nodata":"","dot":false,"ymin":"","ymax":"","removeOlder":"5","removeOlderPoints":"100","removeOlderUnit":"60","cutout":0,"useOneColor":false,"useUTC":false,"colors":["#1f77b4","#aec7e8","#ff7f0e","#2ca02c","#98df8a","#d62728","#ff9896","#9467bd","#c5b0d5"],"outputs":1,"useDifferentColor":false,"className":"","x":490,"y":380,"wires":[["ef3ff83b.aa5008"]]},{"id":"8f316ad0.85cdd8","type":"file","z":"1cf395c5f3a1c332","name":"","filename":"/tmp/chart.log","filenameType":"str","appendNewline":true,"createDir":false,"overwriteFile":"true","x":800,"y":380,"wires":[[]]},{"id":"9b9cfb63.2f50f8","type":"file in","z":"1cf395c5f3a1c332","name":"","filename":"/tmp/chart.log","filenameType":"str","format":"utf8","allProps":false,"x":340,"y":460,"wires":[["b13ea0c3.a7955"]]},{"id":"ef3ff83b.aa5008","type":"json","z":"1cf395c5f3a1c332","name":"","x":630,"y":380,"wires":[["8f316ad0.85cdd8"]]},{"id":"b13ea0c3.a7955","type":"json","z":"1cf395c5f3a1c332","name":"","x":510,"y":460,"wires":[["9e4c2fd0.aac16"]]},{"id":"36042e59a755bf96","type":"ui_ui_control","z":"1cf395c5f3a1c332","name":"","events":"all","x":160,"y":460,"wires":[["9b9cfb63.2f50f8"]]},{"id":"212b7f06.b4731","type":"ui_group","name":"Gauge","tab":"e7f7ff66.2de07","order":2,"disp":true,"width":"6"},{"id":"e7f7ff66.2de07","type":"ui_tab","name":"Restore","icon":"dashboard"}]
1 Like

Thank you for bringing me the light of enlightenment :partying_face:
This was the mistake, "write file" was set to "overwrite", of course I have to set "append", I overlooked that.

A thousand thanks :blue_heart:

First response.

Shrug.

1 Like

Here is a simple example of how to do it using context.

[{"id":"c1ed938e8444bfe2","type":"inject","z":"bdd7be38.d3b55","name":"This is generating data every 2 seconds","props":[{"p":"payload"},{"p":"topic","vt":"str"}],"repeat":"2","crontab":"","once":false,"onceDelay":0.1,"topic":"","payload":"","payloadType":"date","x":200,"y":4360,"wires":[["1e612580123947b9"]]},{"id":"1e612580123947b9","type":"range","z":"bdd7be38.d3b55","minin":"0","maxin":"100000","minout":"0","maxout":"100","action":"roll","round":false,"property":"payload","name":"","x":490,"y":4360,"wires":[["486ae61e6c109681"]]},{"id":"5952b72423d4d17a","type":"debug","z":"bdd7be38.d3b55","name":"debug 2474","active":false,"tosidebar":true,"console":false,"tostatus":false,"complete":"payload","targetType":"msg","statusVal":"","statusType":"auto","x":870,"y":4460,"wires":[]},{"id":"486ae61e6c109681","type":"ui_chart","z":"bdd7be38.d3b55","name":"","group":"903a6ab8.4f4ca8","order":4,"width":0,"height":0,"label":"chart","chartType":"line","legend":"false","xformat":"HH:mm:ss","interpolate":"linear","nodata":"","dot":false,"ymin":"0","ymax":"100","removeOlder":"10","removeOlderPoints":"","removeOlderUnit":"3600","cutout":0,"useOneColor":false,"useUTC":false,"colors":["#1f77b4","#aec7e8","#ff7f0e","#2ca02c","#98df8a","#d62728","#ff9896","#9467bd","#c5b0d5"],"outputs":1,"useDifferentColor":false,"className":"","x":690,"y":4360,"wires":[["5952b72423d4d17a","7e1c593288183a29"]]},{"id":"a428071d4c7e64b2","type":"change","z":"bdd7be38.d3b55","name":"Restore chart data","rules":[{"t":"set","p":"payload","pt":"msg","to":"#:(file)::chart_data","tot":"flow"}],"action":"","property":"","from":"","to":"","reg":false,"x":490,"y":4460,"wires":[["486ae61e6c109681"]]},{"id":"ff5ac4baf6f7a589","type":"inject","z":"bdd7be38.d3b55","name":"This triggers on startup to restore chart data","props":[{"p":"payload"}],"repeat":"","crontab":"","once":true,"onceDelay":0.1,"topic":"","payload":"#:(file)::chart_data","payloadType":"flow","x":210,"y":4460,"wires":[["a428071d4c7e64b2","e00fe342d5e1ac5f"]]},{"id":"7e1c593288183a29","type":"change","z":"bdd7be38.d3b55","name":"Save chart data","rules":[{"t":"set","p":"#:(file)::chart_data","pt":"flow","to":"payload","tot":"msg"}],"action":"","property":"","from":"","to":"","reg":false,"x":860,"y":4360,"wires":[[]]},{"id":"e00fe342d5e1ac5f","type":"debug","z":"bdd7be38.d3b55","name":"debug 2475","active":false,"tosidebar":true,"console":true,"tostatus":false,"complete":"payload","targetType":"msg","statusVal":"","statusType":"auto","x":470,"y":4540,"wires":[]},{"id":"903a6ab8.4f4ca8","type":"ui_group","name":"Home","tab":"e2e6f4f5.56f91","order":1,"disp":false,"width":"6","collapse":false,"className":""},{"id":"e2e6f4f5.56f91","type":"ui_tab","name":"Home","icon":"dashboard","order":3,"disabled":false,"hidden":false}]

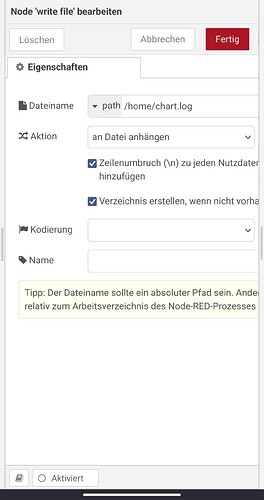
Oh sorry sorry I completely overlooked that :flushed:
But thank you for answering again and giving me the solution.

Many thanks again

This topic was automatically closed 14 days after the last reply. New replies are no longer allowed.